Foods High in Niacin (Vitamin B3)

Top niacin foods: Tuna (13.1 mg in 3 oz), Buckwheat (11.9 mg). See all 142 foods ranked per serving and per 100 g. Data from USDA.

Foods high in vitamin B3

Per serving. Bars show the share of the Daily Value (16 mg a day).

Per 100 g. Bars show the share of the Daily Value (16 mg a day).

Per serving. Bars show the share of the EU Reference Intake (16 mg a day).

Per 100 g. Bars show the share of the EU Reference Intake (16 mg a day).

Per 100 kcal: the same calories of each food, for a fair comparison. Bars compare each food with the top food.

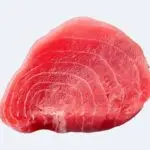
  1. 1.TunaSeafood · per 3 oz (85 g)13.1 mg82% of the Daily Value82% of the Reference Intake
  2. 2.Chicken breastPoultry and Meats · per 4 oz (113 g)10.8 mg68% of the Daily Value68% of the Reference Intake
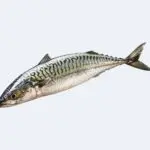
  3. 3.MackerelSeafood · per 1 fillet (112 g)10.2 mg64% of the Daily Value64% of the Reference Intake
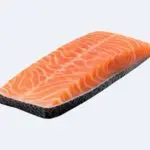
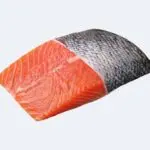
  4. 4.Farmed Atlantic SalmonSeafood · per 3 oz (85 g)7.37 mg46% of the Daily Value46% of the Reference Intake
  5. 5.Ground lambPoultry and Meats · per 4 oz (113 g)6.73 mg42% of the Daily Value42% of the Reference Intake
  6. 6.Wild Atlantic SalmonSeafood · per 3 oz (85 g)6.68 mg42% of the Daily Value42% of the Reference Intake
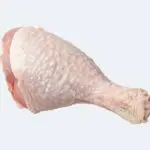
  7. 7.Chicken drumstickPoultry and Meats · per 1 drumstick with skin (133 g)6.44 mg40% of the Daily Value40% of the Reference Intake
  8. 8.SardinesSeafood · per 1 can (92 g)4.83 mg30% of the Daily Value30% of the Reference Intake
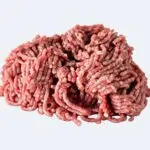
  9. 9.Ground beefPoultry and Meats · per 4 oz (113 g)4.78 mg30% of the Daily Value30% of the Reference Intake
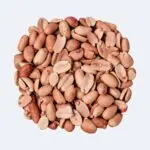
  10. 10.PeanutsNuts and Seeds · per 1 oz (28 g)3.42 mg21% of the Daily Value21% of the Reference Intake
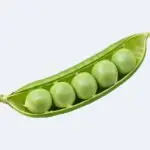
  11. 11.PeasBeans and Legumes · per 1 cup (160 g)3.23 mg20% of the Daily Value20% of the Reference Intake
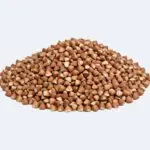
  12. 12.BuckwheatGrains · per ¼ cup (43 g)2.98 mg19% of the Daily Value19% of the Reference Intake
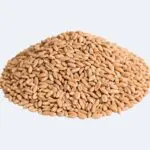
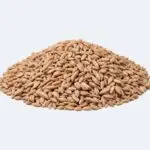
  13. 13.SpeltGrains · per ¼ cup (44 g)2.98 mg19% of the Daily Value19% of the Reference Intake
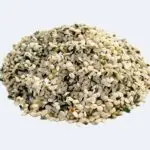
  14. 14.Hemp seedsNuts and Seeds · per 3 tbsp (30 g)2.76 mg17% of the Daily Value17% of the Reference Intake
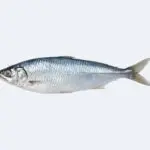
  15. 15.HerringSeafood · per 3 oz (85 g)2.73 mg17% of the Daily Value17% of the Reference Intake
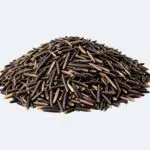
  16. 16.Wild riceGrains · per ¼ cup (40 g)2.69 mg17% of the Daily Value17% of the Reference Intake
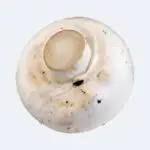
  17. 17.White mushroomsVegetables · per 1 cup (70 g)2.52 mg16% of the Daily Value16% of the Reference Intake
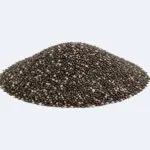
  18. 18.Chia seedsNuts and Seeds · per 1 oz (28 g)2.5 mg16% of the Daily Value16% of the Reference Intake
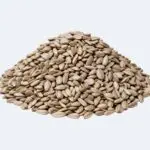
  19. 19.Sunflower seedsNuts and Seeds · per 1 oz (28 g)2.36 mg15% of the Daily Value15% of the Reference Intake
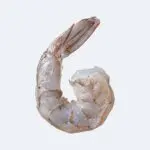
  20. 20.ShrimpSeafood · per 3 oz (85 g)2.28 mg14% of the Daily Value14% of the Reference Intake
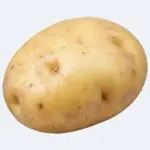
  21. 21.PotatoesVegetables · per 1 medium potato (213 g)2.26 mg14% of the Daily Value14% of the Reference Intake
  22. 22.BarleyGrains · per ¼ cup (46 g)2.12 mg13% of the Daily Value13% of the Reference Intake
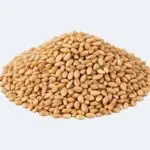
  23. 23.WheatGrains · per ¼ cup (48 g)2.1 mg13% of the Daily Value13% of the Reference Intake
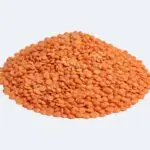
  24. 24.LentilsBeans and Legumes · per 1 cup (198 g)2.1 mg13% of the Daily Value13% of the Reference Intake
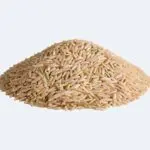
  25. 25.Brown riceGrains · per ¼ cup (48 g)2.05 mg13% of the Daily Value13% of the Reference Intake
  1. 1.TunaSeafood15.4 mg96% of the Daily Value96% of the Reference Intake
  2. 2.PeanutsNuts and Seeds12.1 mg75% of the Daily Value75% of the Reference Intake
  3. 3.Chicken breastPoultry and Meats9.6 mg60% of the Daily Value60% of the Reference Intake
  4. 4.Hemp seedsNuts and Seeds9.2 mg57% of the Daily Value57% of the Reference Intake
  5. 5.MackerelSeafood9.08 mg57% of the Daily Value57% of the Reference Intake
  6. 6.Chia seedsNuts and Seeds8.83 mg55% of the Daily Value55% of the Reference Intake
  7. 7.Farmed Atlantic SalmonSeafood8.67 mg54% of the Daily Value54% of the Reference Intake
  8. 8.Sunflower seedsNuts and Seeds8.34 mg52% of the Daily Value52% of the Reference Intake
  9. 9.Wild Atlantic SalmonSeafood7.86 mg49% of the Daily Value49% of the Reference Intake
  10. 10.BuckwheatGrains7.02 mg44% of the Daily Value44% of the Reference Intake
  11. 11.SpeltGrains6.84 mg43% of the Daily Value43% of the Reference Intake
  12. 12.Wild riceGrains6.73 mg42% of the Daily Value42% of the Reference Intake
  13. 13.Ground lambPoultry and Meats5.96 mg37% of the Daily Value37% of the Reference Intake
  14. 14.SardinesSeafood5.25 mg33% of the Daily Value33% of the Reference Intake
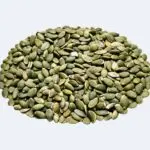
  15. 15.Pumpkin seedsNuts and Seeds4.99 mg31% of the Daily Value31% of the Reference Intake
  16. 16.Chicken drumstickPoultry and Meats4.84 mg30% of the Daily Value30% of the Reference Intake
  17. 17.BarleyGrains4.6 mg29% of the Daily Value29% of the Reference Intake
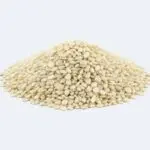
  18. 18.Sesame seedsNuts and Seeds4.52 mg28% of the Daily Value28% of the Reference Intake
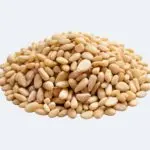
  19. 19.Pine nutsNuts and Seeds4.39 mg27% of the Daily Value27% of the Reference Intake
  20. 20.WheatGrains4.38 mg27% of the Daily Value27% of the Reference Intake
  21. 21.Brown riceGrains4.31 mg27% of the Daily Value27% of the Reference Intake
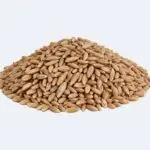
  22. 22.RyeGrains4.27 mg27% of the Daily Value27% of the Reference Intake
  23. 23.Ground beefPoultry and Meats4.23 mg26% of the Daily Value26% of the Reference Intake
  24. 24.AlmondsNuts and Seeds3.62 mg23% of the Daily Value23% of the Reference Intake
  25. 25.White mushroomsVegetables3.61 mg23% of the Daily Value23% of the Reference Intake
  1. 1.White mushroomsVegetables16.4 mg
  2. 2.TunaSeafood15 mg
  3. 3.Chicken breastPoultry and Meats8 mg
  4. 4.Wild Atlantic SalmonSeafood5.54 mg
  5. 5.AsparagusVegetables4.89 mg
  6. 6.CorianderHerbs and spices4.84 mg
  7. 7.MackerelSeafood4.43 mg
  8. 8.Farmed Atlantic SalmonSeafood4.17 mg
  9. 9.BasilHerbs and spices3.92 mg
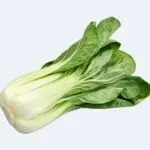
  10. 10.Bok choyVegetables3.85 mg
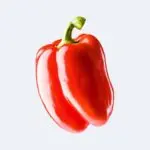
  11. 11.Bell peppersVegetables3.77 mg
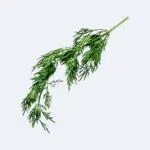
  12. 12.DillHerbs and spices3.65 mg
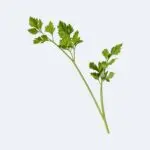
  13. 13.ParsleyHerbs and spices3.65 mg
  14. 14.KaleVegetables3.37 mg
  15. 15.TomatoesVegetables3.3 mg
  16. 16.SpinachVegetables3.15 mg
  17. 17.Garden cressVegetables3.13 mg
  18. 18.Chili peppersHerbs and spices3.11 mg
  19. 19.Chicken drumstickPoultry and Meats3.01 mg
  20. 20.ZucchiniVegetables2.65 mg
  21. 21.EggplantVegetables2.6 mg
  22. 22.SardinesSeafood2.52 mg
  23. 23.CodSeafood2.52 mg
  24. 24.OystersSeafood2.48 mg
  25. 25.PeppermintHerbs and spices2.44 mg

Draft: content follows in phase 4.