Foods High in Vitamin B12 (Cobalamin)

Highest in vitamin B12: Sardines (13.3 mcg in 1 cup, drained). All 17 foods ranked per serving, per 100 g and per 100 kcal, with % DV.

Foods high in vitamin B12

Per serving. Bars show the share of the Daily Value (2.4 µg a day). The line marks 100%.

Per 100 g. Bars show the share of the Daily Value (2.4 µg a day). The line marks 100%.

Per serving. Bars show the share of the EU Reference Intake (2.5 µg a day). The line marks 100%.

Per 100 g. Bars show the share of the EU Reference Intake (2.5 µg a day). The line marks 100%.

Per 100 kcal: the same calories of each food, for a fair comparison. Bars compare each food with the top food.

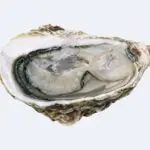
  1. 1.OystersSeafood · per 3 oz (85 g)13.6 µg567% of the Daily Value544% of the Reference Intake
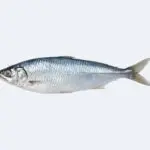
  2. 2.HerringSeafood · per 3 oz (85 g)11.6 µg484% of the Daily Value465% of the Reference Intake
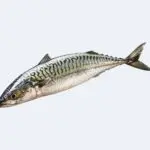
  3. 3.MackerelSeafood · per 1 fillet (112 g)9.8 µg406% of the Daily Value390% of the Reference Intake
  4. 4.SardinesSeafood · per 1 can (92 g)8.2 µg343% of the Daily Value329% of the Reference Intake
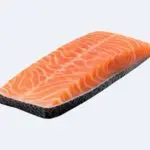
  5. 5.Farmed Atlantic SalmonSeafood · per 3 oz (85 g)2.7 µg114% of the Daily Value110% of the Reference Intake
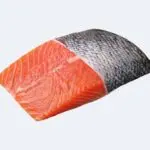
  6. 6.Wild Atlantic SalmonSeafood · per 3 oz (85 g)2.7 µg113% of the Daily Value108% of the Reference Intake
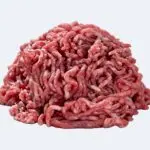
  7. 7.Ground lambPoultry and Meats · per 4 oz (113 g)2.6 µg109% of the Daily Value104% of the Reference Intake
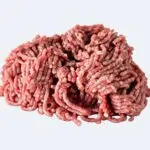
  8. 8.Ground beefPoultry and Meats · per 4 oz (113 g)2.4 µg101% of the Daily Value97% of the Reference Intake
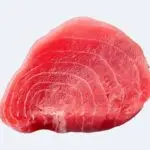
  9. 9.TunaSeafood · per 3 oz (85 g)1.6 µg67% of the Daily Value65% of the Reference Intake
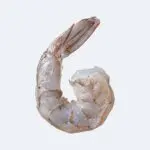
  10. 10.ShrimpSeafood · per 3 oz (85 g)1.4 µg59% of the Daily Value56% of the Reference Intake
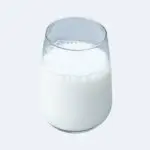
  11. 11.Semi-skimmed cows milkEggs and Dairy · per 1 cup (246 g)1.3 µg54% of the Daily Value52% of the Reference Intake
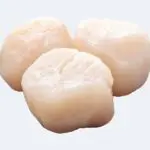
  12. 12.ScallopsSeafood · per 3 oz (85 g)1.2 µg50% of the Daily Value48% of the Reference Intake
  13. 13.CodSeafood · per 3 oz (85 g)0.8 µg32% of the Daily Value31% of the Reference Intake
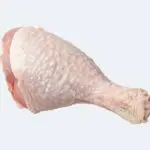
  14. 14.Chicken drumstickPoultry and Meats · per 1 drumstick with skin (133 g)0.7 µg29% of the Daily Value28% of the Reference Intake
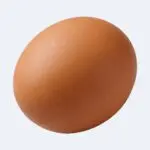
  15. 15.EggsEggs and Dairy · per 1 large (50 g)0.4 µg19% of the Daily Value18% of the Reference Intake
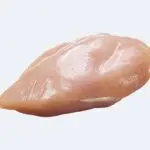
  16. 16.Chicken breastPoultry and Meats · per 4 oz (113 g)0.2 µg10% of the Daily Value9% of the Reference Intake
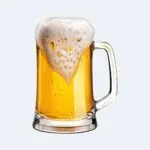
  17. 17.BeerBeverages · per 1 can (356 g)0.1 µg3% of the Daily Value3% of the Reference Intake
  18. 18.White mushroomsVegetables · per 1 cup (70 g)0.03 µg1% of the Daily Value1% of the Reference Intake
  1. 1.OystersSeafood16 µg667% of the Daily Value640% of the Reference Intake
  2. 2.HerringSeafood13.7 µg570% of the Daily Value547% of the Reference Intake
  3. 3.SardinesSeafood8.9 µg373% of the Daily Value358% of the Reference Intake
  4. 4.MackerelSeafood8.7 µg363% of the Daily Value348% of the Reference Intake
  5. 5.Farmed Atlantic SalmonSeafood3.2 µg135% of the Daily Value129% of the Reference Intake
  6. 6.Wild Atlantic SalmonSeafood3.2 µg133% of the Daily Value127% of the Reference Intake
  7. 7.Ground lambPoultry and Meats2.3 µg96% of the Daily Value92% of the Reference Intake
  8. 8.Ground beefPoultry and Meats2.1 µg89% of the Daily Value86% of the Reference Intake
  9. 9.TunaSeafood1.9 µg79% of the Daily Value76% of the Reference Intake
  10. 10.ShrimpSeafood1.7 µg69% of the Daily Value66% of the Reference Intake
  11. 11.ScallopsSeafood1.4 µg59% of the Daily Value56% of the Reference Intake
  12. 12.CodSeafood0.9 µg38% of the Daily Value36% of the Reference Intake
  13. 13.EggsEggs and Dairy0.9 µg37% of the Daily Value36% of the Reference Intake
  14. 14.Semi-skimmed cows milkEggs and Dairy0.5 µg22% of the Daily Value21% of the Reference Intake
  15. 15.Chicken drumstickPoultry and Meats0.5 µg22% of the Daily Value21% of the Reference Intake
  16. 16.Chicken breastPoultry and Meats0.2 µg9% of the Daily Value8% of the Reference Intake
  17. 17.White mushroomsVegetables0.04 µg2% of the Daily Value2% of the Reference Intake
  18. 18.BeerBeverages0.02 µg<1% of the Daily Value<1% of the Reference Intake
  1. 1.OystersSeafood19.8 µg
  2. 2.HerringSeafood8.7 µg
  3. 3.SardinesSeafood4.3 µg
  4. 4.MackerelSeafood4.2 µg
  5. 5.Wild Atlantic SalmonSeafood2.2 µg
  6. 6.ScallopsSeafood2 µg
  7. 7.TunaSeafood1.8 µg
  8. 8.Farmed Atlantic SalmonSeafood1.6 µg
  9. 9.ShrimpSeafood1.4 µg
  10. 10.CodSeafood1.1 µg
  11. 11.Semi-skimmed cows milkEggs and Dairy1.1 µg
  12. 12.Ground beefPoultry and Meats0.8 µg
  13. 13.Ground lambPoultry and Meats0.8 µg
  14. 14.EggsEggs and Dairy0.6 µg
  15. 15.Chicken drumstickPoultry and Meats0.3 µg
  16. 16.White mushroomsVegetables0.2 µg
  17. 17.Chicken breastPoultry and Meats0.2 µg
  18. 18.BeerBeverages0.05 µg

Draft: content follows in phase 4.