Foods High in Sodium

Highest in sodium: Sardines (457 mg in 1 cup, drained). All 135 foods ranked per serving, per 100 g and per 100 kcal, with % DV.

Foods high in sodium

Per serving. Bars show the share of the Daily Value (2,300 mg a day).

Per 100 g. Bars show the share of the Daily Value (2,300 mg a day).

Per serving. Bars show the share of the EU Reference Intake (2,400 mg a day).

Per 100 g. Bars show the share of the EU Reference Intake (2,400 mg a day).

Per 100 kcal: the same calories of each food, for a fair comparison. Bars compare each food with the top food.

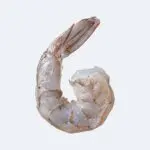
  1. 1.ShrimpSeafood · per 3 oz (85 g)805 mg35% of the Daily Value34% of the Reference Intake
  2. 2.ScallopsSeafood · per 3 oz (85 g)333 mg14% of the Daily Value14% of the Reference Intake
  3. 3.SardinesSeafood · per 1 can (92 g)282 mg12% of the Daily Value12% of the Reference Intake
  4. 4.OlivesFruits · per 5 large olives (22 g)162 mg7% of the Daily Value7% of the Reference Intake
  5. 5.Chicken drumstickPoultry and Meats · per 1 drumstick with skin (133 g)141 mg6% of the Daily Value6% of the Reference Intake
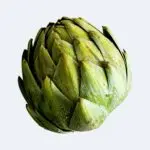
  6. 6.ArtichokeVegetables · per 1 artichoke (128 g)120 mg5% of the Daily Value5% of the Reference Intake
  7. 7.Semi-skimmed cows milkEggs and Dairy · per 1 cup (246 g)116 mg5% of the Daily Value5% of the Reference Intake
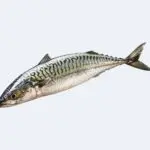
  8. 8.MackerelSeafood · per 1 fillet (112 g)101 mg4% of the Daily Value4% of the Reference Intake
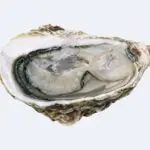
  9. 9.OystersSeafood · per 3 oz (85 g)90.1 mg4% of the Daily Value4% of the Reference Intake
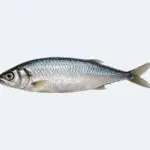
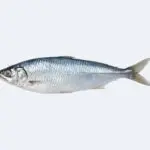
  10. 10.HerringSeafood · per 3 oz (85 g)76.5 mg3% of the Daily Value3% of the Reference Intake
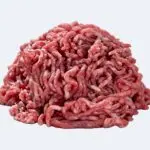
  11. 11.Ground beefPoultry and Meats · per 4 oz (113 g)74.6 mg3% of the Daily Value3% of the Reference Intake
  12. 12.EggsEggs and Dairy · per 1 large (50 g)71 mg3% of the Daily Value3% of the Reference Intake
  13. 13.Ground lambPoultry and Meats · per 4 oz (113 g)66.7 mg3% of the Daily Value3% of the Reference Intake
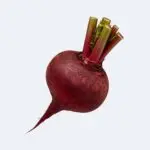
  14. 14.BeetsVegetables · per 1 beet (82 g)64 mg3% of the Daily Value3% of the Reference Intake
  15. 15.Chicken breastPoultry and Meats · per 4 oz (113 g)50.9 mg2% of the Daily Value2% of the Reference Intake
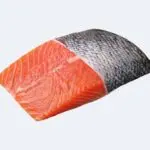
  16. 16.Farmed Atlantic SalmonSeafood · per 3 oz (85 g)50.2 mg2% of the Daily Value2% of the Reference Intake
  17. 17.CodSeafood · per 3 oz (85 g)45.9 mg2% of the Daily Value2% of the Reference Intake
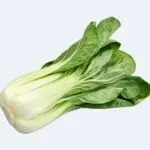
  18. 18.Bok choyVegetables · per 1 cup (70 g)45.5 mg2% of the Daily Value2% of the Reference Intake
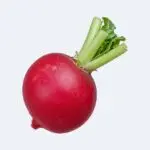
  19. 19.RadishesVegetables · per 1 cup (116 g)45.2 mg2% of the Daily Value2% of the Reference Intake
  20. 20.CarrotsVegetables · per 1 medium (61 g)42.1 mg2% of the Daily Value2% of the Reference Intake
  21. 21.Sweet potatoesVegetables · per 1 medium (151 g)40.8 mg2% of the Daily Value2% of the Reference Intake
  22. 22.Wild Atlantic SalmonSeafood · per 3 oz (85 g)37.4 mg2% of the Daily Value2% of the Reference Intake
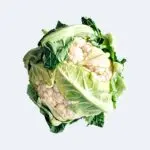
  23. 23.CauliflowerVegetables · per 1 cup (107 g)32.1 mg1% of the Daily Value1% of the Reference Intake
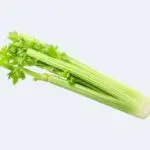
  24. 24.CeleryVegetables · per 1 stalk (40 g)32 mg1% of the Daily Value1% of the Reference Intake
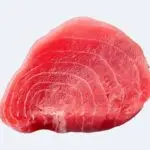
  25. 25.TunaSeafood · per 3 oz (85 g)31.5 mg1% of the Daily Value1% of the Reference Intake
  1. 1.ShrimpSeafood947 mg41% of the Daily Value39% of the Reference Intake
  2. 2.OlivesFruits735 mg32% of the Daily Value31% of the Reference Intake
  3. 3.ScallopsSeafood392 mg17% of the Daily Value16% of the Reference Intake
  4. 4.SardinesSeafood307 mg13% of the Daily Value13% of the Reference Intake
  5. 5.EggsEggs and Dairy142 mg6% of the Daily Value6% of the Reference Intake
  6. 6.Chicken drumstickPoultry and Meats106 mg5% of the Daily Value4% of the Reference Intake
  7. 7.OystersSeafood106 mg5% of the Daily Value4% of the Reference Intake
  8. 8.ArtichokeVegetables94 mg4% of the Daily Value4% of the Reference Intake
  9. 9.MackerelSeafood90 mg4% of the Daily Value4% of the Reference Intake
  10. 10.HerringSeafood90 mg4% of the Daily Value4% of the Reference Intake
  11. 11.CeleryVegetables80 mg3% of the Daily Value3% of the Reference Intake
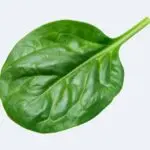
  12. 12.SpinachVegetables79 mg3% of the Daily Value3% of the Reference Intake
  13. 13.BeetsVegetables78 mg3% of the Daily Value3% of the Reference Intake
  14. 14.CarrotsVegetables69 mg3% of the Daily Value3% of the Reference Intake
  15. 15.Ground beefPoultry and Meats66 mg3% of the Daily Value3% of the Reference Intake
  16. 16.Bok choyVegetables65 mg3% of the Daily Value3% of the Reference Intake
  17. 17.DillHerbs and spices61 mg3% of the Daily Value3% of the Reference Intake
  18. 18.Farmed Atlantic SalmonSeafood59 mg3% of the Daily Value2% of the Reference Intake
  19. 19.Ground lambPoultry and Meats59 mg3% of the Daily Value2% of the Reference Intake
  20. 20.ParsleyHerbs and spices56 mg2% of the Daily Value2% of the Reference Intake
  21. 21.CodSeafood54 mg2% of the Daily Value2% of the Reference Intake
  22. 22.KaleVegetables53 mg2% of the Daily Value2% of the Reference Intake
  23. 23.Semi-skimmed cows milkEggs and Dairy47 mg2% of the Daily Value2% of the Reference Intake
  24. 24.CorianderHerbs and spices46 mg2% of the Daily Value2% of the Reference Intake
  25. 25.Chicken breastPoultry and Meats45 mg2% of the Daily Value2% of the Reference Intake
  1. 1.ShrimpSeafood796 mg
  2. 2.OlivesFruits634 mg
  3. 3.CeleryVegetables571 mg
  4. 4.ScallopsSeafood568 mg
  5. 5.Bok choyVegetables500 mg
  6. 6.SpinachVegetables343 mg
  7. 7.RadishesVegetables244 mg
  8. 8.ArtichokeVegetables200 mg
  9. 9.CorianderHerbs and spices200 mg
  10. 10.BeetsVegetables181 mg
  11. 11.CarrotsVegetables168 mg
  12. 12.ParsleyHerbs and spices156 mg
  13. 13.KaleVegetables151 mg
  14. 14.SardinesSeafood148 mg
  15. 15.DillHerbs and spices142 mg
  16. 16.OystersSeafood131 mg
  17. 17.EndiveVegetables129 mg
  18. 18.CauliflowerVegetables120 mg
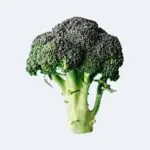
  19. 19.BroccoliVegetables116 mg
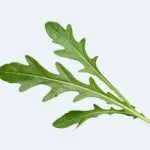
  20. 20.ArugulaVegetables108 mg
  21. 21.EggsEggs and Dairy99.3 mg
  22. 22.Semi-skimmed cows milkEggs and Dairy94 mg
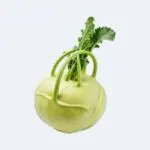
  23. 23.KohlrabiVegetables74.1 mg
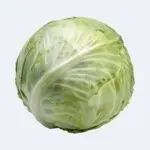
  24. 24.CabbageVegetables72 mg
  25. 25.Iceberg lettuceVegetables71.4 mg

Draft: content follows in phase 4.