
Phosphorus is an essential mineral that your body holds as phosphate. The NIH (the US National Institutes of Health) says it is part of bones and teeth, DNA and RNA, and the fats in cell membranes. It is also part of ATP, the cell’s key energy source. Phosphorus makes up about 1% to 1.4% of fat-free body mass, and 85% of that is in bones and teeth.
Here is the part most people do not know: the concern is too much, not too little. Most Americans eat more phosphorus than the amounts recommended. In 2015 to 2016 survey data, women averaged 1,189 mg from food and men 1,596 mg.
Across 13 surveys in nine EU countries, adults averaged between 1,000 and 1,767 mg. Deficiency is rare in the United States and almost never the result of low dietary intake.
The part worth knowing about is additives. Phosphate is added to processed food to keep moisture and color and to stabilize frozen foods. The NIH estimates it adds 300 to 1,000 mg to daily intake. That phosphate is absorbed more fully than most natural phosphorus, and food tables probably undercount it.
High intakes rarely cause problems in healthy people, the NIH says, but when the kidneys fail, phosphate builds up. That is why most of the evidence below is about kidney disease.
Health benefits of phosphorus
The top findings from 38 studies, strongest evidence first
What the stars mean
- Strong. Several randomized trials, pooled in a meta-analysis, point the same way, or regulators (FDA or EFSA) have approved the claim.
- Moderate. Good randomized trials support it, but there are fewer of them, or their results vary.
- Limited. Small, short or single trials, or mixed results. Promising, but it needs confirmation.
Population and lab studies get no stars: they show a link or a mechanism, not proof.
How we rate evidence →- ★★★EU authorizes four claims, from energy to teethThe EU lets foods say phosphorus contributes to normal energy metabolism, cell membranes, bones and teeth. The wording is not a treatment claim and does not say extra phosphorus helps.
- ★★Swapping additive foods lowered phosphorus on dialysisIn 134 people on hemodialysis, swapping processed foods with phosphorus additives for similar foods lowered blood phosphorus (from 7.2 to 5.0 mg/dL) in 90 days. With usual advice it changed little (7.1 to 6.7 mg/dL).
- ★★Mixed results for phosphate-binder drugsSevelamer, a prescription drug that binds phosphate, gave 0.54 times the risk of death versus calcium-based binders in kidney disease, on low-certainty evidence. A trial of 2,103 people on hemodialysis found no clear difference in death rates.
- ★★No change in blood phosphate from extra phosphorusHealthy adults took 1,000 mg of phosphorus a day as monosodium phosphate for 8 weeks, and fasting blood phosphate did not change. With no added calcium, urinary calcium and magnesium fell.
- ★★Some iron infusions lowered blood phosphateIn two trials in iron-deficiency anemia, low blood phosphate followed about 74% to 75% of ferric carboxymaltose infusions, against about 8% of iron isomaltoside. In bowel disease, it followed 51% of carboxymaltose and 8% of derisomaltose infusions.
All 26 studies, strongest evidence first
The EU authorizes four phosphorus claims, from energy to bones and teeth
Regulation (EU) No 432/2012 lists these claims. Phosphorus contributes to normal energy-yielding metabolism, to normal function of cell membranes, and to the maintenance of normal bones and of normal teeth. A food may carry them only if it is at least a source of phosphorus under Regulation (EC) No 1924/2006. As a rule, that means 15% of the 700 mg Nutrient Reference Value per 100 g. That is 105 mg, under Regulation (EU) No 1169/2011. The wording says phosphorus contributes to these functions; it is not a treatment claim, and it does not say extra phosphorus helps.
Sevelamer may lower death risk versus calcium binders on dialysis
Phosphate binders are prescription drugs that bind phosphate in the gut. This 2025 Cochrane review (Cochrane is known for careful reviews of trials) pooled 134 trials in 20,913 adults with chronic kidney disease. Against calcium-based binders, sevelamer gave 0.54 times the risk of death (19 studies, 4,403 people), on low-certainty evidence, and caused less high blood calcium. Against placebo or usual care, no binder showed a clear benefit for heart deaths or coronary artery calcium, and sevelamer and lanthanum may cause constipation. Most trials were short (median 5.4 months), and the authors rate the certainty as low or very low.
Sevelamer and calcium binders did not clearly differ in death rates
In this open-label trial, 2,103 people on hemodialysis (blood filtering by machine) were assigned by chance to sevelamer or a calcium-based binder. Of them, 1,068 completed the study. Death rates from all causes and from specific causes (heart, infection, other) did not clearly differ. Only in patients over 65 years was the death rate lower on sevelamer, and the authors say this needs confirming. The larger Cochrane review above pooled many trials and found a lower death risk with sevelamer.
In two trials, ferric carboxymaltose lowered blood phosphate far more often
Two identical open-label trials gave iron infusions to 245 adults with iron-deficiency anemia who could not take or had not responded to iron pills. Low blood phosphate, defined as serum phosphate below 2.0 mg/dL within 35 days, is called hypophosphatemia. It followed about 74% to 75% of ferric carboxymaltose infusions but only about 8% of iron isomaltoside infusions (adjusted differences -67.0% and -65.8%). The authors say the clinical importance of the difference needs more research. One author is an employee of the maker of iron isomaltoside, and several report fees from it.
In bowel disease, ferric carboxymaltose lowered phosphate more often than derisomaltose
This double-blind trial (PHOSPHARE-IBD) gave intravenous iron for iron-deficiency anemia to 97 adults with inflammatory bowel disease. Phosphate fell below 2.0 mg/dL within 35 days after 51% of carboxymaltose and 8% of derisomaltose treatments (adjusted risk difference -42.8%). Both products corrected the anemia, but fatigue scores improved more slowly with carboxymaltose. Slower improvement went with a bigger fall in phosphate. The maker of ferric derisomaltose funded the trial and employs one author.
The 2017 KDIGO guideline suggests lowering high phosphate and limiting diet phosphate
For people with chronic kidney disease from stage G3a to dialysis, the guideline suggests lowering high phosphate toward normal (grade 2C). It also suggests limiting dietary phosphate, alone or with other treatments (grade 2D), and it grades both as weak recommendations. It adds that it is reasonable to consider the phosphate source (animal, vegetable or additives). The work group says trial data showing that lowering phosphate improves outcomes patients feel are still lacking, which is why the recommendation stays weak.
Low-phosphorus diets lowered serum phosphate by 0.18 mmol/L in kidney disease
This Cochrane review of diets for mineral and bone disorder in kidney disease covered 9 small studies in 634 people. They lasted 4 to 24 weeks. The low-phosphorus result came from 2 studies in 359 people (mean difference -0.18 mmol/L, a unit of blood concentration). The one trial that counted deaths found no clear difference, and no study reported heart events or fractures. The authors call the evidence limited and of low quality.
Diet plus lanthanum lowered FGF23 by 35%; neither alone clearly did
This single-blind 2 x 2 trial had 39 people with stage 3 or 4 kidney disease and normal blood phosphate, over 3 months. It tested a 900 mg phosphate diet and lanthanum carbonate (1,000 mg three times a day with meals), alone and together, against placebo. The diet alone and the drug alone did not clearly lower FGF23, a hormone linked to harm in kidney disease. The combination cut it by 35%. The trial was small, and its main outcome was the FGF23 level, not heart or death outcomes.
If artery calcium grew slowly, sevelamer went with fewer deaths
This analysis, planned only after the fact, looked at 113 people from a randomized trial of two binder regimens. All had stage 3 to 4 kidney disease and coronary artery calcium, ate a phosphorus-restricted diet and were followed for 36 months. Among those whose artery calcium grew slowly, sevelamer also went with less dialysis. Calcium carbonate went with faster calcium progression and more deaths. Because the analysis was unplanned and both groups ate the restricted diet, it cannot show what the diet alone did.
Cutting calories in refeeding syndrome did not clearly add days alive
This single-blind trial in 13 intensive care units included 339 critically ill adults with refeeding syndrome. Refeeding syndrome includes a fall in blood phosphate after nutrition starts. Days alive after leaving intensive care were 44.8 on restricted calories against 39.9 on standard support, a difference of 4.9 days that could be chance. More were alive at day 60 with restriction (91% against 78%), but that was one part of the main outcome, not the main result.
Ten days of cola raised PTH and bone breakdown markers
In this crossover study, 11 young men on a low-calcium diet had two 10-day periods. They drank either 2.5 liters of cola a day or the same amount of milk. On cola, serum phosphate, active vitamin D, PTH (parathyroid hormone) and osteocalcin rose. The bone breakdown markers CTX and NTX also rose compared with milk, while serum calcium did not change. The study shows short-term changes in markers, not bone loss.
In small sports studies, sodium phosphate improved some exercise measures
This narrative review covered small studies of sodium phosphate capsules, 3 to 5 g a day for 3 to 6 days. Reported changes included aerobic capacity, peak power and anaerobic threshold. The authors say the studies differ in dose, washout period and fitness of the participants, and that women have been little studied. It is a review without a pooled result, and the dose is far above food amounts.
High blood phosphate went with a 36% higher risk of heart death
This meta-analysis (a study that pools earlier studies) combined 6 prospective cohorts with 120,269 people without chronic kidney disease. Against the reference level, the highest blood phosphate went with 1.36 times the risk of heart death and 1.35 times for death from any cause. Risk of death from any cause was higher in men (1.33) but not clearly in women (1.09). Cohorts show association, not cause, and blood phosphate is not the same as phosphorus intake.
Top-quarter blood phosphate went with 1.55 times the heart disease risk
The Framingham Offspring cohort followed 3,368 adults free of heart and kidney disease for a mean of 16.1 years. There were 524 cardiovascular events. The adjusted risk for the top quartile against the bottom was 1.55 times as high. Serum calcium was not related to risk, and the authors call for research on the link between phosphorus handling and vascular risk.
Above 1,400 mg a day, phosphorus intake went with higher death rates
This NHANES III cohort (from a US national health survey) followed 9,686 healthy adults to 2006, with intake from a single 24-hour recall. Below 1,400 mg a day there was no link. Above it, the risk of death from any cause rose 2.23-fold per unit of log intake, a statistical scale. Phosphorus density (phosphorus per calorie) was linked to heart death (hazard ratio 3.39), but intake itself was not. The nutrient database could not separate organic and inorganic phosphorus. The journal published an erratum (correction) in 2017 that we could not read, so these figures are from the abstract.
Once other foods were counted, phosphorus did not predict high blood pressure
The ARIC and MESA cohorts followed 13,444 adults for about 6.2 years, with 3,345 new cases of high blood pressure. Before adjusting for other foods, the top fifth of intake had 2.0 mm Hg lower systolic pressure (the top number). After that adjustment, the risk of high blood pressure was 1.01 times as high, no difference. Phosphorus from dairy foods, but not from other sources, went with lower risk, so dairy itself may explain it.
High intake was not linked to more deaths in moderate kidney disease
This NHANES III analysis covered 1,105 adults with moderate kidney disease. The lowest third of intake averaged 532 mg a day and the highest third 1,478 mg. Serum phosphate was similar in both (3.5 and 3.6 mg/dL). After adjustment, the risk was 0.98 times as high, no clear difference. The authors think blood phosphate stays normal at this stage of kidney function and call for trials.
Urine phosphate was not linked to kidney failure or death
This analysis of the Modification of Diet in Renal Disease study covered people with stage 3 to 5 kidney disease. Their 24-hour urine phosphate, a marker of intake, showed no link with end-stage kidney disease, heart death, other deaths or death from any cause. For comparison, serum phosphate 0.7 mg/dL higher went with 1.15 times the risk of death. Intake was only modestly linked to the blood level.
Per 1 mg/dL more phosphate, kidney failure risk rose 36%
This meta-analysis pooled 12 cohorts with 25,546 people with kidney disease who were not on dialysis. Per 1 mg/dL, kidney failure was 1.36 times as likely and death 1.20 times as likely. The authors note that residual confounding (hidden differences between groups) could not be excluded. They call for randomized trials targeting phosphate control.
On dialysis, high and low phosphate both went with more deaths
This meta-analysis of 9 cohorts covered 1,992,869 people with end-stage kidney disease, with 24,463 deaths over 12 to 97.6 months. Against the reference range, the risk of death was 1.39 times as high at the highest phosphate and 1.16 times at the lowest. The authors describe a non-linear link, stronger within 2 years.
In women, daily cola went with 3.7% lower hip bone density
In the Framingham Osteoporosis Study, X-ray bone scans of 1,413 women compared daily cola drinkers with those drinking cola less than once a month. That figure is for the femoral neck, the narrow part of the thigh bone just below the hip joint. The link held at each hip site (5.4% lower at Ward’s area) but not the spine, and not in 1,125 men. Diet cola gave similar results, and other carbonated drinks showed none. Total phosphorus intake was not clearly higher in daily cola drinkers, but their calcium-to-phosphorus ratios were lower. The authors ask for more research.
Fizzy drinks went with 3 times the fracture odds in teen girls
This cross-sectional study at one urban high school covered 460 teenage girls, with self-reported drinks and past fractures. Carbonated drinks went with 3.14 times the odds of a past fracture, and colas with 4.94 times in physically active girls. Because the data are retrospective (looking back) and self-reported, and the drinks displace milk, the link cannot be pinned on phosphorus.
The diet’s calcium-to-phosphorus ratio did not track bone density
This NHANES 2005 to 2006 cross-sectional study covered 1,228 adults aged 50 and over. The calcium-to-phosphorus ratio was not linked to hip or spine bone density. No trend emerged for any age or sex group after adjusting for body mass index, even among those taking large amounts of calcium supplements. The authors conclude that high phosphorus intake and low ratios do not harm bone density at major fracture sites. They note that total phosphorus was not fully assessed.
Sodium phosphate bowel prep did not raise acute kidney injury
This US insurance claims analysis compared 121,266 colonoscopy patients who used sodium phosphate with 429,430 who used polyethylene glycol, before the FDA warning. Acute kidney injury occurred in 0.2% against 0.3% (adjusted hazard ratio 0.86), with no consistent increase in higher-risk subgroups. The authors note that the FDA has warned against sodium phosphate because of concerns about kidney injury and calcification. A claims database cannot confirm the cause of each case.
Of 31 kidney calcium biopsies, 21 followed sodium phosphate bowel prep
This case series came from 7,349 kidney biopsies at one center from 2000 to 2004. The 21 people had kidney failure after the prep: 81% were women, their mean age was 64 and their blood calcium was normal. About a month after colonoscopy, their mean creatinine (a kidney blood marker) was 3.9 mg/dL. Four needed permanent dialysis, and the other 17 had chronic kidney insufficiency. The authors named this acute phosphate nephropathy. They listed poor hydration, older age, high blood pressure and ACE inhibitors or angiotensin receptor blockers as possible factors.
In malnourished patients, refeeding syndrome went with more deaths
This secondary analysis of a nutrition trial covered 967 malnourished hospital patients. Refeeding syndrome, which includes electrolyte shifts such as low phosphate after feeding starts, was confirmed in 141 (14.6%). By 180 days, 29.8% of them had died, against 21.9% of the others (adjusted odds ratio 1.53). They also had more intensive care admissions and longer stays.
Foods high in phosphorus
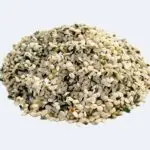
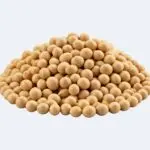
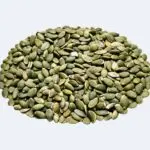
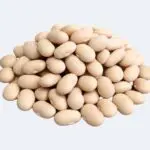
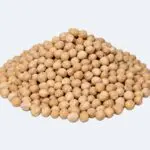
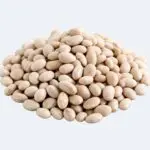
Seeds, beans, seafood and nuts lead our USDA ranking. Per serving, hemp seeds top the list: 3 tablespoons (30 g) hold 495 mg of phosphorus. That is 40% of the Daily Value, the 1,250 mg figure US food labels use. Sardines follow with 451 mg per can, and soybeans come next with 421 mg per cup.
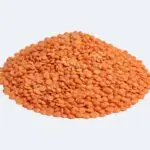
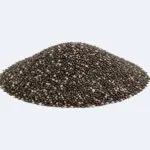
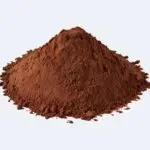
Lentils and scallops also make the list. Per 100 g, hemp seeds (1,650 mg) are followed by pumpkin seeds (1,233 mg) and chia seeds (860 mg). Per 100 kcal, scallops (484 mg), white mushrooms (391 mg) and cocoa powder (322 mg) lead. The ranking below has the full list.
The NIH table shows what many people actually eat. Plain low-fat yogurt has 245 mg in a 6-ounce container, and 2% milk 226 mg per cup. Farmed Atlantic salmon has 214 mg in 3 ounces, chicken breast 182 mg in 3 ounces and a hard-boiled large egg 86 mg. Dairy supplies about 20% of US phosphorus intake, and bakery products 10%.
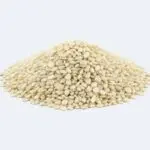
A high number on a list is not the same as an absorbed amount, though. In a lab digestion test, sesame seeds with hull held 667 mg per 100 g, but only 6% was digestible. Legumes averaged 38%, and muffins leavened with sodium phosphate were 100% digestible. A cup of cola has only 18 mg, but cola drinks were 87% to 100% digestible.
Per serving. Bars show the share of the Daily Value (1,250 mg a day).
Per 100 g. Bars show the share of the Daily Value (1,250 mg a day). The line marks 100%.
Per serving. Bars show the share of the EU Reference Intake (700 mg a day).
Per 100 g. Bars show the share of the EU Reference Intake (700 mg a day). The line marks 100%.
Per 100 kcal: the same calories of each food, for a fair comparison. Bars compare each food with the top food.
- 1.
- 2.

- 3.
- 4.
- 5.
- 6.
- 7.
- 8.

- 9.
- 10.


- 1.
- 2.
- 3.
- 4.
- 5.

- 6.
- 7.
- 8.
- 9.
- 10.


- 1.
- 2.

- 3.
- 4.
- 5.

- 6.

- 7.

- 8.

- 9.

- 10.



Sources
- FoodData Central. US Department of Agriculture, Agricultural Research Service. Values as shown in the ranking above.
- Phosphorus: fact sheet for health professionals. National Institutes of Health, Office of Dietary Supplements. Updated May 4, 2023.
- Karp H, Ekholm P, Kemi V, et al. Differences among total and in vitro digestible phosphorus content of plant foods and beverages. J Ren Nutr. 2012.
How phosphorus works
The biochemistry below is well established. But it comes from reviews, official reports and physiology studies rather than from trials of extra phosphorus. Four ideas cover most of it.
Phosphate is a building block of bone, genes, membranes and energy. Most of it is stored in bone. The gut absorbs most of what you eat, but the form matters. And hormones and the kidneys keep the blood level steady.
Kidney failure breaks the last step. Then comes what has been seen in people.
It is a building block of bone, genes, membranes and energy
In the body, phosphorus occurs as phosphate. Bones and teeth hold it as hydroxyapatite, the mineral that calcium also builds. The rest sits in DNA and RNA, in the phospholipids that form cell membranes and in ATP.
Many proteins and sugars are phosphorylated (tagged with phosphate), which helps switch enzymes on and off. Phosphate also helps keep the acidity of body fluid normal, according to the NIH.
Four main jobs of phosphate in the body. Not to scale.
Most of it is stored in bone
EFSA (the EU’s food safety agency) puts 85% of the body’s phosphorus in bones and teeth. Soft tissues such as muscle, liver, heart and kidney hold 14%, and fluids outside the cells only 1%. That is why a blood test is a poor guide to what you hold. The NIH says plasma and serum phosphate do not necessarily reflect whole-body content.
Calcium and phosphorus are tied together in bone. EFSA estimates the molar ratio (counted in atoms, not weight) of calcium to phosphorus in the whole body at about 1.4:1 to 1.9:1. It used that ratio to set the EU intake values.
Where the body keeps phosphorus, drawn to scale.
The gut absorbs most of it, but the form matters
EFSA says net absorption in adults typically runs from 55% to 80% of usual intakes. A balance analysis found a mean of 60.3% in one data set and 53.0% in another.
Plants store phosphorus as phytic acid, and because humans lack the enzyme phytase, much of it is unavailable, the NIH says. Yeast can break it down, so leavened bread is better absorbed than unleavened, and gut bacteria release some. A 2021 review of human diets high in phytate puts absorption at 50% or more, higher than the 10% to 30% often assumed.
Calcium eaten at the same time binds phosphorus: each extra 0.5 g of calcium cut phosphorus absorption by 0.166 g. Phosphate additives are the most fully absorbed form, at about 70% according to the NIH and 80% to 90% according to EFSA’s 2019 review.
Published absorption estimates, drawn to scale. They come from different sources and methods, so they do not line up exactly. The bar for plant diets is open-ended, because the review says at least 50%.
Hormones and the kidneys keep the level steady
EFSA describes a loop between bone, the kidneys and the parathyroid glands. When blood phosphate rises, the parathyroid glands release more PTH (parathyroid hormone) and bone cells release more FGF23. Both make the kidneys excrete more phosphate. FGF23 also lowers the active form of vitamin D, which reduces absorption in the gut.
The kidneys take back about 80% of the phosphate they filter, in the proximal tubule, and about 15% ends up in urine. In a human loading study, healthy adults got phosphate for 36 hours, by vein or through a tube into the gut.
Blood phosphate and PTH rose first, and phosphate clearance by the kidneys rose 4- to 6-fold. FGF23 rose after excretion began, and active vitamin D then fell. After the loading stopped, blood phosphate dipped below normal.
The order of events in a 36-hour phosphate loading study in healthy adults. The last step, less absorption in the gut, is EFSA’s description and was not measured in that study.
When the kidneys fail, phosphate piles up
As kidney function declines, phosphate excretion becomes less efficient and serum phosphate rises. PTH and FGF23 then lose their ability to hold the level down, according to the NIH. The resulting problem is called chronic kidney disease-mineral and bone disorder.
It involves abnormal calcium, phosphorus, PTH and vitamin D, abnormal bone, and calcification of blood vessels and other soft tissue. Chronic kidney disease affects 5% to 10% of people worldwide. At moderate stages, intake and blood level are only loosely linked. In a US survey, serum phosphate was about the same in the lowest and highest thirds of phosphorus intake.
What has been seen in people
The clearest human findings are about the kidney. Cohort studies link higher blood phosphate with more deaths and heart events, in kidney disease and in people with healthy kidneys. Guidelines suggest lowering high levels.
But phosphate-lowering drugs have not shown a clear benefit over placebo for heart or death outcomes, and diet trials are small and short. A one-week feeding study found that foods with additives changed hormone levels. A 3-week trial, though, found no change in urine albumin or FGF23. The long-term effects on bone and blood vessels in healthy people are unproven.
All of these are among the study cards above and below.
Sources
- Phosphorus: fact sheet for health professionals. National Institutes of Health, Office of Dietary Supplements. Updated May 4, 2023.
- EFSA Panel on Dietetic Products, Nutrition and Allergies (NDA). Scientific opinion on Dietary Reference Values for phosphorus. EFSA J. 2015.
- Heaney RP, Nordin BE. Calcium effects on phosphorus absorption: implications for the prevention and co-therapy of osteoporosis. J Am Coll Nutr. 2002.
- Scanni R, vonRotz M, Jehle S, Hulter HN, Krapf R. The human response to acute enteral and parenteral phosphate loads. J Am Soc Nephrol. 2014.
- EFSA Panel on Food Additives and Flavourings (FAF). Re-evaluation of phosphoric acid-phosphates – di-, tri- and polyphosphates (E 338-341, E 343, E 450-452) as food additives and the safety of proposed extension of use. EFSA J. 2019.
- Calvo MS, Uribarri J. Perspective: plant-based whole-grain foods for chronic kidney disease: the phytate-phosphorus conundrum. Adv Nutr. 2021.
- Murtaugh MA, Filipowicz R, Baird BC, et al. Dietary phosphorus intake and mortality in moderate chronic kidney disease: NHANES III. Nephrol Dial Transplant. 2012.
How much phosphorus do you need?
Adults need 700 mg of phosphorus a day, according to the US recommended dietary allowance (RDA, the amount that covers nearly all healthy people). Teenagers and children aged 9 to 18 need 1,250 mg. EFSA’s adequate intake (an amount assumed to be enough) for EU adults is 550 mg.
For younger children, the US allowance is 460 mg at ages 1 to 3 and 500 mg at ages 4 to 8. EFSA gives 250 mg for ages 1 to 3 and 440 mg for ages 4 to 10.
Pregnancy and breastfeeding do not raise the US allowance: it stays 700 mg from age 19 and 1,250 mg at ages 14 to 18. EFSA also keeps its adult value of 550 mg for pregnant and breastfeeding women, because phosphorus metabolism adapts during these stages. For older adults the US allowance stays at 700 mg, and EFSA’s adult value covers them too. EFSA notes, though, that absorption tends to fall with age.
Most adults eat well above these numbers, and EFSA could not derive an average requirement at all. It built its values from the calcium targets and the body’s calcium-to-phosphorus ratio.
Phosphorus: recommended intake per day
US: Adequate Intake / Recommended Dietary Allowance (NASEM). EU: Adequate Intake (EFSA).
| Age and sex | US (RDA) | EU (AI) |
|---|---|---|
| Men, 31–50 years | 700 mg | 550 mg |
| Women, 31–50 years | 700 mg | 550 mg |
All ages, pregnancy and breastfeeding
| Age and sex | US (AI/RDA) | EU (AI) |
|---|---|---|
| Infants 0–6 months | 100 mg | None set |
| Infants 7–11 months | None set | 160 mg |
| Infants 7–12 months | 275 mg | None set |
| Children 1–3 years | 460 mg | 250 mg |
| Children 4–8 years | 500 mg | None set |
| Children 4–10 years | None set | 440 mg |
| Females 9–13 years | 1,250 mg | None set |
| Males 9–13 years | 1,250 mg | None set |
| Children 11–17 years | None set | 640 mg |
| Females 14–18 years | 1,250 mg | None set |
| Males 14–18 years | 1,250 mg | None set |
| Adults 18+ years | None set | 550 mg |
| Females 19–30 years | 700 mg | None set |
| Males 19–30 years | 700 mg | None set |
| Females 31–50 years | 700 mg | None set |
| Males 31–50 years | 700 mg | None set |
| Females 51–70 years | 700 mg | None set |
| Males 51–70 years | 700 mg | None set |
| Females >70 years | 700 mg | None set |
| Males >70 years | 700 mg | None set |
| Pregnancy 14–18 years | 1,250 mg | None set |
| Pregnancy | None set | 550 mg |
| Pregnancy 19–30 years | 700 mg | None set |
| Pregnancy 31–50 years | 700 mg | None set |
| Lactation 14–18 years | 1,250 mg | None set |
| Lactation | None set | 550 mg |
| Lactation 19–30 years | 700 mg | None set |
| Lactation 31–50 years | 700 mg | None set |
EU and US age bands differ; "None set" means that body sets no value for the group. Label reference: FDA Daily Value 1,250 mg, EU Reference Intake 700 mg.EU and US age bands differ; "None set" means that body sets no value for the group. Label reference: EU Reference Intake 700 mg, FDA Daily Value 1,250 mg.
Phosphorus deficiency: signs and who is at risk
Low blood phosphate (hypophosphatemia) is rare and almost never the result of low dietary intake, says the NIH. Effects can include loss of appetite, anemia, weakness of the muscles closest to the trunk and bone pain. Others are rickets in children, osteomalacia (soft bones) in adults, more infections, tingling, poor coordination and confusion.
EFSA says clinical symptoms usually appear when serum phosphate falls below 0.3 mmol/L (1 mg/dL), and that their severity depends on the cause. A 2006 review reports hypophosphatemia in about 2% of hospitalized patients.
In most cases it comes from a medical condition, such as an overactive parathyroid gland, a kidney tubule defect or diabetic ketoacidosis. A review of emergency department patients lists several risks for abnormal phosphate levels. They are diabetic ketoacidosis, chronic obstructive lung disease, alcoholism, cancer and kidney failure.
The NIH also names preterm newborns, who are born with low bone stores, and people with rare inherited disorders such as X-linked hypophosphatemic rickets. It names people with severe malnutrition too. When these people start eating or being fed again, refeeding syndrome can develop within 2 to 5 days. In severe cases it brings weak muscles, breathing failure, confusion, heart failure and death.
ASPEN, a US clinical nutrition society, defined it in a 2020 consensus. It is a fall in blood phosphorus, potassium or magnesium of at least 10% within 5 days of restarting calories. In a Swiss study of malnourished hospital patients, 14.6% had it.
Medicines matter too. Using antacids with aluminum hydroxide for 3 months or longer can lower phosphate by binding it in the gut. In trials, some intravenous iron products caused low phosphate in about three of four people.
Doctors check serum phosphate. The NIH gives a normal adult range of 2.5 to 4.5 mg/dL (0.81 to 1.45 mmol/L). It cautions that blood levels may not reflect total body content. Treatment aims at the cause.
A 2006 review found little evidence that moderate low phosphate has important consequences outside ventilated patients. But it says severe cases should be treated, and refeeding risk needs a care team, not self-treatment.
Sources
- Phosphorus: fact sheet for health professionals. National Institutes of Health, Office of Dietary Supplements. Updated May 4, 2023.
- EFSA Panel on Dietetic Products, Nutrition and Allergies (NDA). Scientific opinion on Dietary Reference Values for phosphorus. EFSA J. 2015.
- Institute of Medicine, Food and Nutrition Board. Dietary Reference Intakes for calcium, phosphorus, magnesium, vitamin D, and fluoride. National Academy Press. 1997.
- Amanzadeh J, Reilly RF Jr. Hypophosphatemia: an evidence-based approach to its clinical consequences and management. Nat Clin Pract Nephrol. 2006.
- Shiber JR, Mattu A. Serum phosphate abnormalities in the emergency department. J Emerg Med. 2002.
- da Silva JSV, Seres DS, Sabino K, et al. ASPEN consensus recommendations for refeeding syndrome. Nutr Clin Pract. 2020.
- Friedli N, Baumann J, Hummel R, et al. Refeeding syndrome is associated with increased mortality in malnourished medical inpatients: secondary analysis of a randomized trial. Medicine (Baltimore). 2020.
- Wolf M, Rubin J, Achebe M, et al. Effects of iron isomaltoside vs ferric carboxymaltose on hypophosphatemia in iron-deficiency anemia: two randomized clinical trials. JAMA. 2020.
Forms of phosphorus: absorption and effects
Phosphorus reaches you in four main forms. There is organic phosphorus built into the proteins, fats and sugars of food, and phytic acid in seeds and other plant foods. There are inorganic phosphate salts added to processed food, and phosphate salts in supplements and medicines.
The NIH puts the absorption of natural food phosphorus at 40% to 70%, higher from animal foods than from plants. It puts additive and supplement phosphate at about 70%, and EFSA’s 2019 review says additive phosphate is absorbed at 80% to 90%.
In the EU, additives carry E numbers. E 338 is phosphoric acid, and E 339, E 340, E 341 and E 343 are the sodium, potassium, calcium and magnesium phosphates. E 450, E 451 and E 452 are the di-, tri- and polyphosphates. US food labels do not have to list phosphorus unless it was added.
The honest bottom line: measured studies agree that additive phosphate is absorbed fully, and short feeding studies show hormone changes. But the studies below are small and short, and none shows that additive phosphorus harms people with healthy kidneys.
In dialysis cohorts, more phosphorus from processed sources goes with higher mortality. An industry-linked US survey analysis found no meaningful link in healthy adults. The trials in the benefits section used the binders sevelamer, lanthanum and calcium carbonate, and sodium phosphate bowel preps. They also used intravenous iron products that lower blood phosphate.
| Form | Share of the mineral by weight | What studies show | Source |
|---|---|---|---|
| Organic phosphorus in animal foods (meat, dairy, fish, eggs) | Not stated | The NIH says absorption of natural food phosphorus is 40% to 70%, higher from animal sources than from plants. EFSA gives 55% to 80% net absorption in adults, and balance data gave a mean of 60.3% and 53.0% in two data sets. In a 24-hour test with identical foods, meat raised markers of bone formation and resorption and cheese lowered PTH, while only the phosphate supplement raised PTH. | 1, 2, 7, 14 |
| Phytic acid in plants (seeds, nuts, legumes, whole grains, unleavened bread) | Not stated | Humans lack phytase, so much is unavailable, but yeast leavening breaks it down and gut bacteria release some. In a digestion test, 6% of the phosphorus in sesame seeds with hull and 38% in legumes was digestible. A 2021 review of human diets puts absorption at 50% or more. In a 1-week crossover, 9 people with kidney disease had lower blood phosphate and FGF23 on a vegetarian diet than on a meat diet, and in dialysis patients a higher plant share went with lower mortality. | 1, 2, 4, 6, 12, 15 |
| Inorganic phosphate additives (E 338 to 341, E 343, E 450 to 452) | Not stated | Absorbed at about 70% (NIH) or 80% to 90% (EFSA). Muffins with sodium phosphate leavening were 100% digestible in a lab test, and enhanced meats had a phosphate-to-protein ratio 28% higher on average, with 8 of 25 not listing the additive. One week of additive foods raised FGF23 by 23% in 10 healthy adults, and in a 1977 study of 8 adults a diet with additives caused soft stools or mild diarrhea. In 31 adults with early kidney disease, 3 weeks of extra additives did not significantly raise urine albumin. In 134 dialysis patients, swapping additive foods for others cut serum phosphorus from 7.2 to 5.0 mg/dL. | 1, 3, 4, 5, 8, 9, 10, 11 |
| Phosphate salts in supplements (dipotassium, disodium and monosodium phosphate) | Not stated | The NIH puts bioavailability at about 70%, and says the bioavailability of phospholipid forms such as phosphatidylcholine has not been determined in humans. Most products give 10% or less of the Daily Value. Of the sources in a 24-hour test, only the supplement raised PTH. In 62 healthy adults, 1,000 mg of phosphorus a day as monosodium phosphate for 8 weeks left fasting plasma phosphate unchanged. EFSA notes mild digestive symptoms in some people above 750 mg a day from supplements. Athletes’ phosphate loading used 3 to 5 g of sodium phosphate a day. | 1, 7, 13, 17, 18 |
| Phosphoric acid in cola | Not stated | A cup of cola has 18 mg of phosphorus (NIH). In women, daily cola intake went with lower hip bone density, including with diet cola. In a 10-day crossover in young men on a low-calcium diet, 2.5 liters of cola a day raised PTH and bone resorption markers against milk. | 1, 22, 23 |
| Sodium phosphate laxatives and bowel preps | Not stated | These are medicines, not supplements. The FDA warns that using more than one dose of the over-the-counter products in 24 hours can seriously harm the kidneys and heart, and the prescription bowel-prep tablets carry a boxed warning for acute phosphate nephropathy. See the safety section. | 19, 20, 21 |
Here are the head-to-head and form-specific studies, strongest evidence first, 12 in all. We found no trial that compared health outcomes of additive and natural phosphorus over months or years in people with healthy kidneys. A phytate-rich plant diet is not clearly worse absorbed than assumed, since the 2021 review says at least half is absorbed.
All 12 studies, strongest evidence first
Extra monosodium phosphate did not change fasting blood phosphate in healthy adults
In this double-blind, placebo-controlled trial, 62 healthy adults took 1,000 mg of phosphorus a day as monosodium phosphate for 8 weeks. Groups also got 0, 0.5 or 1 g of calcium a day (as calcium carbonate). Urinary and fecal phosphorus rose in every group. With no added calcium, urinary calcium and magnesium fell, which the authors read as a negative effect on calcium metabolism. FGF23 was higher at 4 weeks than at 8.
Swapping additive foods cut serum phosphorus from 7.2 to 5.0 mg/dL
This trial at one center randomized 134 people on hemodialysis for 90 days. The intervention group got personal advice on replacing processed foods that contain phosphorus additives with foods of similar nutritional value. The control group got the usual advice, and its serum phosphorus did not clearly change (7.1 to 6.7 mg/dL). In the intervention group, 69.7% reached the target of 5.5 mg/dL or less, against 18.5%. Nutritional status and protein intake did not differ.
In 16 young women, only the phosphate supplement raised PTH
This randomized crossover study had five 24-hour sessions. Phosphorus intake was about 1,500 mg, with 1,000 mg of it from meat, cheese, whole grains or a phosphate supplement. The foods were otherwise identical, and phosphorus from meat or whole grains did not raise PTH. Compared with the control session, meat raised markers of bone formation and bone breakdown, and cheese lowered PTH and bone breakdown. Calcium intake was only about 250 mg in the control session, and the effects were short-term.
One week of additive foods raised FGF23 by 23%
In this feeding study, 10 healthy adults ate about 1,000 mg of phosphorus a day from additive-free foods for a week. Right after, they ate the same foods made with additives, which added 606 mg of phosphorus. Against the additive-free week, osteopontin rose 10% and osteocalcin 11%, and sclerostin fell. The order was fixed, not randomized, and mice on a high-phosphorus diet had lower bone density. The authors say the animal results suggest that this may compromise bone health.
Four weeks of additives caused soft stools, more bone breakdown markers
This 1977 feeding study had 8 adults. A control diet with 1.0 g of phosphorus a day was followed by a diet with 2.1 g, in which additive foods replaced their counterparts. Serum and urine phosphorus rose, serum and urine calcium fell, and urine hydroxyproline rose, which the authors read as a sign of parathyroid activity. Intestinal distress, soft stools or mild diarrhea faded in six of the eight.
Extra phosphorus additives for 3 weeks did not clearly raise urine albumin
In this double-blind crossover trial, 31 adults with early kidney disease had diet drinks and breakfast bars with added phosphorus. These added 993 mg of phosphorus a day, and 24-hour urine phosphorus rose by 505 mg. Albumin in urine (a sign of kidney damage) rose 14.3% and FGF23 3.4%, and neither change was clear. The authors cite the small size, short duration and changes in background diet as limits.
One vegetarian week gave lower blood phosphate and FGF23 than meat
In this crossover trial, 9 people with kidney disease ate two 7-day diets with the same nutrients, prepared by research staff. Their mean eGFR, a measure of kidney function, was 32 mL/min. The authors conclude that the protein source changes phosphorus handling, so counseling should cover the source as well as the amount. The trial was very small.
Net phosphorus absorption averaged 60.3% and 53.0%; calcium cut it
This analysis used two data sets from inpatient metabolic units: 543 balance studies of women and 93 of men and women. Fecal calcium was the main factor tied to fecal phosphorus. Each 0.5 g rise in calcium intake lowered phosphorus absorption by 0.166 g. The authors suggest that people on calcium for osteoporosis may need some of it as a calcium phosphate preparation.
On hemodialysis, processed-food phosphorus went with more deaths, plant phosphorus with fewer
The DIET-HD cohort followed 8,110 people on hemodialysis for a median 3.8 years, with 2,953 deaths. Each standard deviation (a measure of spread, here 896 mg a day) of total phosphorus went with 1.16 times the risk of death. A higher plant share of phosphorus went with 0.95 times the risk, and a higher processed-and-other share with 1.06 times. The authors say the link is driven largely by processed food.
US survey: phosphorus not meaningfully linked to deaths
This analysis of NHANES 1988 to 1994 and 2001 to 2016 used industry-provided data on the phosphate ingredients and amounts in foods. In healthy adults, it found no meaningful link between total, added or natural phosphorus and death. Added phosphorus went with lower HDL (“good”) cholesterol, and natural phosphorus with lower risk of high blood pressure, but predicted changes were small. The authors work for a firm that analyzes NHANES data for food companies. One received honoraria from the International Food Additives Council, and the funders reviewed drafts.
Sesame phosphorus was 6% digestible; cola and beer 87% to 100%
This Finnish lab test measured digestible phosphorus in 21 plant foods and drinks. Sesame seeds with hull held 667 mg of total phosphorus per 100 g. Legumes averaged 83 mg of digestible phosphorus per 100 g (38% of total). Industrial muffins with sodium phosphate as a leavening agent had 216 mg per 100 g, all of it digestible. The authors say this supports the effective absorption of additive phosphorus. It is an in vitro (test tube) test, not absorption in people.
Meat with phosphate additives had 28% more phosphate per protein on average
This lab analysis of 36 raw meat and poultry products used official AOAC methods. Products with phosphate additives had a phosphate-to-protein ratio up to almost 100% higher, and could carry almost twice the phosphorus of additive-free ones. Of 25 enhanced products, 8 did not list the additives on the label. The authors say the results cannot be applied to other products and that formulations change over time.
Sources
- Phosphorus: fact sheet for health professionals. National Institutes of Health, Office of Dietary Supplements. Updated May 4, 2023.
- EFSA Panel on Dietetic Products, Nutrition and Allergies (NDA). Scientific opinion on Dietary Reference Values for phosphorus. EFSA J. 2015.
- EFSA Panel on Food Additives and Flavourings (FAF). Re-evaluation of phosphoric acid-phosphates – di-, tri- and polyphosphates (E 338-341, E 343, E 450-452) as food additives and the safety of proposed extension of use. EFSA J. 2019.
- Karp H, Ekholm P, Kemi V, et al. Differences among total and in vitro digestible phosphorus content of plant foods and beverages. J Ren Nutr. 2012.
- Sherman RA, Mehta O. Phosphorus and potassium content of enhanced meat and poultry products: implications for patients who receive dialysis. Clin J Am Soc Nephrol. 2009.
- Calvo MS, Uribarri J. Perspective: plant-based whole-grain foods for chronic kidney disease: the phytate-phosphorus conundrum. Adv Nutr. 2021.
- Karp HJ, Vaihia KP, Kärkkäinen MU, Niemistö MJ, Lamberg-Allardt CJ. Acute effects of different phosphorus sources on calcium and bone metabolism in young women: a whole-foods approach. Calcif Tissue Int. 2007.
- Gutiérrez OM, Luzuriaga-McPherson A, Lin Y, Gilbert LC, Ha SW, Beck GR Jr. Impact of phosphorus-based food additives on bone and mineral metabolism. J Clin Endocrinol Metab. 2015.
- Bell RR, Draper HH, Tzeng DY, Shin HK, Schmidt GR. Physiological responses of human adults to foods containing phosphate additives. J Nutr. 1977.
- Chang AR, Miller ER 3rd, Anderson CA, et al. Phosphorus additives and albuminuria in early stages of CKD: a randomized controlled trial. Am J Kidney Dis. 2017.
- de Fornasari ML, Dos Santos Sens YA. Replacing phosphorus-containing food additives with foods without additives reduces phosphatemia in end-stage renal disease patients: a randomized clinical trial. J Ren Nutr. 2017.
- Moe SM, Zidehsarai MP, Chambers MA, et al. Vegetarian compared with meat dietary protein source and phosphorus homeostasis in chronic kidney disease. Clin J Am Soc Nephrol. 2011.
- Trautvetter U, Jahreis G, Kiehntopf M, Glei M. Consequences of a high phosphorus intake on mineral metabolism and bone remodeling in dependence of calcium intake in healthy subjects – a randomized placebo-controlled human intervention study. Nutr J. 2016.
- Heaney RP, Nordin BE. Calcium effects on phosphorus absorption: implications for the prevention and co-therapy of osteoporosis. J Am Coll Nutr. 2002.
- Su G, Saglimbene V, Wong G, et al. Dietary phosphorus, its sources, and mortality in adults on haemodialysis: the DIET-HD study. Nutrients. 2022.
- Fulgoni K, Fulgoni VL 3rd, Wallace TC. Association of total, added, and natural phosphorus intakes with biomarkers of health status and mortality in healthy adults in the United States. Nutrients. 2022.
- EFSA Panel on Dietetic Products, Nutrition and Allergies (NDA). Opinion related to the tolerable upper intake level of phosphorus. EFSA J. 2005.
- Buck CL, Wallman KE, Dawson B, Guelfi KJ. Sodium phosphate as an ergogenic aid. Sports Med. 2013.
- US Food and Drug Administration. FDA Drug Safety Communication: FDA warns of possible harm from exceeding recommended dose of over-the-counter sodium phosphate products to treat constipation. January 8, 2014. Archived copy (the FDA page has been removed).
- US Food and Drug Administration. OsmoPrep (sodium phosphate tablets) prescribing information, with boxed warning on acute phosphate nephropathy. Revised November 2018.
- Markowitz GS, Stokes MB, Radhakrishnan J, D’Agati VD. Acute phosphate nephropathy following oral sodium phosphate bowel purgative: an underrecognized cause of chronic renal failure. J Am Soc Nephrol. 2005.
- Tucker KL, Morita K, Qiao N, Hannan MT, Cupples LA, Kiel DP. Colas, but not other carbonated beverages, are associated with low bone mineral density in older women: the Framingham Osteoporosis Study. Am J Clin Nutr. 2006.
- Kristensen M, Jensen M, Kudsk J, Henriksen M, Mølgaard C. Short-term effects on bone turnover of replacing milk with cola beverages: a 10-day interventional study in young men. Osteoporos Int. 2005.
Is phosphorus safe? Supplements, dose and interactions
Phosphorus from food rarely causes problems in healthy people, according to the NIH. The US tolerable upper intake level (UL, the likely-safe daily maximum) covers food and supplements. It is 4,000 mg a day for ages 9 to 70 and 3,500 mg in pregnancy at ages 14 to 50. It is 3,000 mg for ages 1 to 8 and from age 71.
The UL rests on intakes linked with normal blood phosphate, and it does not apply to people who get phosphate under medical supervision. EFSA did not set an upper level. Its 2005 opinion found the data insufficient. But it concluded that healthy people tolerate at least 3,000 mg a day from all sources without systemic adverse effects.
It added that some people had mild digestive symptoms above 750 mg a day from supplements. Current EU intakes, it said, show no evidence of harm. EFSA’s 2019 review of additives set a group acceptable daily intake of 40 mg of phosphorus per kg of body weight. That is 2,800 mg for a 70 kg adult, and it does not apply to people with moderate to severe kidney problems.
- Digestive effects. Phosphate supplements above 750 mg a day caused osmotic diarrhea, nausea and vomiting in some healthy people (EFSA 2005). In the 1977 feeding study, a diet with 2.1 g of phosphorus from additive foods caused soft stools or mild diarrhea. Sodium phosphate used by athletes (3 to 5 g a day) is far above food amounts.
- Kidney disease. People with reduced kidney function cannot clear phosphate well, so the EFSA additive limit does not apply to them. The KDIGO guideline suggests limiting dietary phosphate when blood phosphate is high. Prescription phosphate binders (sevelamer, lanthanum, calcium acetate or carbonate, and iron-based binders) are taken with meals and may cause constipation or nausea. They are drugs for a care team to manage, not supplements. Limiting phosphorus can also cut protein intake, because protein-rich foods are high in both.
- Laxatives and bowel preps. The FDA warns about taking more than one dose in 24 hours of over-the-counter sodium phosphate laxatives, oral or rectal. This can cause rare but serious harm to the kidneys and heart, and even death. Higher-risk groups include young children, adults over 55, dehydrated people and those with kidney disease, bowel obstruction or inflammation. People taking diuretics, ACE inhibitors, angiotensin receptor blockers or NSAIDs are also at higher risk. Prescription sodium phosphate tablets for colonoscopy carry a boxed warning for acute phosphate nephropathy (kidney damage from phosphate). In some cases it caused permanent kidney damage or long-term dialysis. The NIH adds that two 6,600 mg doses of sodium phosphate in one day can cause high blood phosphate.
- Antacids, calcium and other medicines. Antacids with aluminum hydroxide bind phosphorus and can cause low phosphate after 3 months or more (NIH). Calcium carbonate antacids also reduce absorption (NIH), and calcium supplements bind dietary phosphorus too. People with kidney or heart disease, or who take regular medicines, should ask a doctor or pharmacist before using phosphate products.
How to get the right amount of phosphorus
- Read ingredient lists. Phosphate additives appear as phosphoric acid, sodium phosphate or sodium polyphosphate (NIH). In the EU they appear as E 338 to 341, E 343 and E 450 to 452. In one lab study, 8 of 25 enhanced meat products did not list the additive.
- Choose food over pills. Beans, nuts, seeds, whole grains, dairy, fish and eggs supply phosphorus, and the NIH says supplements are rarely needed. Most products give 10% or less of the Daily Value.
- With kidney disease, ask a renal dietitian. KDIGO suggests considering the phosphate source (animal, vegetable, additives). In a trial, swapping additive foods lowered serum phosphorus from 7.2 to 5.0 mg/dL in 90 days.
Sources
- Phosphorus: fact sheet for health professionals. National Institutes of Health, Office of Dietary Supplements. Updated May 4, 2023.
- EFSA Panel on Food Additives and Flavourings (FAF). Re-evaluation of phosphoric acid-phosphates – di-, tri- and polyphosphates (E 338-341, E 343, E 450-452) as food additives and the safety of proposed extension of use. EFSA J. 2019.
- EFSA Panel on Dietetic Products, Nutrition and Allergies (NDA). Opinion related to the tolerable upper intake level of phosphorus. EFSA J. 2005.
- Kidney Disease: Improving Global Outcomes (KDIGO) CKD-MBD Update Work Group. KDIGO 2017 clinical practice guideline update for the diagnosis, evaluation, prevention, and treatment of chronic kidney disease-mineral and bone disorder (CKD-MBD). Kidney Int Suppl. 2017.
- Sherman RA, Mehta O. Phosphorus and potassium content of enhanced meat and poultry products: implications for patients who receive dialysis. Clin J Am Soc Nephrol. 2009.
- de Fornasari ML, Dos Santos Sens YA. Replacing phosphorus-containing food additives with foods without additives reduces phosphatemia in end-stage renal disease patients: a randomized clinical trial. J Ren Nutr. 2017.
- Gutiérrez OM, Luzuriaga-McPherson A, Lin Y, Gilbert LC, Ha SW, Beck GR Jr. Impact of phosphorus-based food additives on bone and mineral metabolism. J Clin Endocrinol Metab. 2015.
- Bell RR, Draper HH, Tzeng DY, Shin HK, Schmidt GR. Physiological responses of human adults to foods containing phosphate additives. J Nutr. 1977.
- Natale P, Green SC, Ruospo M, et al. Phosphate binders for preventing and treating chronic kidney disease-mineral and bone disorder (CKD-MBD). Cochrane Database Syst Rev. 2025.
- US Food and Drug Administration. FDA Drug Safety Communication: FDA warns of possible harm from exceeding recommended dose of over-the-counter sodium phosphate products to treat constipation. January 8, 2014. Archived copy (the FDA page has been removed).
- US Food and Drug Administration. OsmoPrep (sodium phosphate tablets) prescribing information, with boxed warning on acute phosphate nephropathy. Revised November 2018.
- Wolf M, Rubin J, Achebe M, et al. Effects of iron isomaltoside vs ferric carboxymaltose on hypophosphatemia in iron-deficiency anemia: two randomized clinical trials. JAMA. 2020.
- Markowitz GS, Stokes MB, Radhakrishnan J, D’Agati VD. Acute phosphate nephropathy following oral sodium phosphate bowel purgative: an underrecognized cause of chronic renal failure. J Am Soc Nephrol. 2005.
- Layton JB, Klemmer PJ, Christiansen CF, et al. Sodium phosphate does not increase risk for acute kidney injury after routine colonoscopy, compared with polyethylene glycol. Clin Gastroenterol Hepatol. 2014.
Frequently asked questions about phosphorus
Is too much phosphorus bad for you?
In healthy people, high intakes rarely cause problems, according to the NIH. EFSA concluded that healthy adults tolerate at least 3,000 mg a day from all sources without systemic adverse effects. The real concern is kidney disease, where phosphate builds up. In cohort studies, higher blood phosphate goes with more heart disease and deaths, but that does not prove cause. One US cohort of 9,686 healthy adults found higher mortality above 1,400 mg a day of intake. Another, in 1,105 people with moderate kidney disease, found no link.
Are phosphate additives worse than natural phosphorus?
For absorption, yes: the NIH puts additive phosphorus at about 70% absorbed and natural food phosphorus at 40% to 70%. EFSA’s 2019 review says 80% to 90% for additives. In a digestion test, muffins with sodium phosphate were fully digestible, while sesame seeds were 6%. Whether this harms people with healthy kidneys is unproven. A feeding study in 10 adults raised FGF23 by 23% in a week. A 3-week trial in 31 adults with early kidney disease found no clear rise in urine albumin. Look for “phos” in ingredient lists, or E 338 to 341, E 343 and E 450 to 452 in the EU.
How much phosphorus per day should kidney patients have?
There is no single number. The 2017 KDIGO guideline suggests limiting dietary phosphate when blood phosphate is high in chronic kidney disease stage G3a and beyond. It grades that as a weak recommendation and says to consider the source (animal, vegetable or additives). A Cochrane review found low-phosphorus diets lowered serum phosphate by 0.18 mmol/L in 2 studies. The right amount depends on the stage, blood phosphate and protein needs, so a renal dietitian should set it. Binders are prescription drugs, not self-treatment.
How much phosphorus is in one egg?
A hard-boiled large egg has 86 mg of phosphorus, 7% of the Daily Value, according to the NIH table. That is about 12% of the 700 mg US allowance for adults. See the eggs page for the full nutrition profile.
Does cola weaken bones?
Evidence is limited. A cup of cola has only 18 mg of phosphorus (NIH). In the Framingham study, women who drank cola daily had 3.7% lower bone density at the femoral neck, and diet cola showed similar results. Their total phosphorus intake was not clearly higher. In a 10-day crossover study, 11 men on a low-calcium diet drank 2.5 liters of cola a day. Compared with milk, it raised PTH and bone breakdown markers. These studies show links and short-term markers, not bone loss, and cola may simply displace milk.
What does a phosphorus blood test show?
It measures phosphate in serum. The NIH gives a normal adult range of 2.5 to 4.5 mg/dL (0.81 to 1.45 mmol/L). It says phosphorus status is not typically assessed, so it is not a routine check. It also cautions that blood levels do not necessarily reflect whole-body phosphorus. In stage 3 to 5 kidney disease, phosphate intake was only modestly linked to the blood level.
Do I need a phosphorus supplement?
Almost never. Most adults eat well above 700 mg a day from food, and the NIH says deficiency is almost never the result of low intake. Doctors prescribe phosphate for specific conditions, such as some rare inherited forms of rickets. Supplements usually give 10% or less of the Daily Value, and a small share give more than 100%. EFSA reports mild digestive symptoms in some people above 750 mg a day.
What happens if phosphorus is too low?
Low blood phosphate can cause loss of appetite, muscle weakness, bone pain, tingling and confusion. Severe cases can cause breathing failure and heart problems. It is usually caused by illness, alcohol use, refeeding after starvation or certain medicines, not diet. Tell a doctor if you have these symptoms, especially after a long period of poor eating.