Proteins

How much protein you need a day by age, from US and EU tables. Which foods give the most protein in USDA data, and a guide to the amino acids.

1 proteins

  • Amino acids

    Amino acids are the building blocks of protein. Browse the 9 essential amino acids and the others we cover, each with its food sources and studies.

Protein: recommended intake per day

US: Recommended Dietary Allowance (NASEM). EU: Population Reference Intake (EFSA).

Age and sexUS (RDA)EU (PRI)
Men, 31–50 years56 g56.5 g
Women, 31–50 years46 g48.6 g
All ages, pregnancy and breastfeeding
Age and sexUS (RDA)EU (PRI)
Children 1 year, femaleNone set13.1 g
Children 1 year, maleNone set13.9 g
Children 1–3 years13 gNone set
Children 2 years, femaleNone set11.2 g
Children 2 years, maleNone set11.8 g
Children 3 years, femaleNone set10.4 g
Children 3 years, maleNone set11 g
Children 4 years, femaleNone set16.1 g
Children 4 years, maleNone set16.5 g
Children 4–8 years19 gNone set
Children 5 years, femaleNone set15.9 g
Children 5 years, maleNone set16.3 g
Children 6 years, femaleNone set16.6 g
Children 6 years, maleNone set17.1 g
Children 7 years, femaleNone set25.8 g
Children 7 years, maleNone set26.4 g
Children 8 years, femaleNone set26.1 g
Children 8 years, maleNone set26.7 g
Children 9 years, femaleNone set26.1 g
Children 9 years, maleNone set26.7 g
Males and females 9–13 years34 gNone set
Children 10 years, femaleNone set25.8 g
Children 10 years, maleNone set26.4 g
Children 11 years, femaleNone set40.6 g
Children 11 years, maleNone set40 g
Children 12 years, femaleNone set40.1 g
Children 12 years, maleNone set39.6 g
Children 13 years, femaleNone set39.7 g
Children 13 years, maleNone set39.6 g
Children 14 years, femaleNone set39.2 g
Children 14 years, maleNone set39.2 g
Females 14–18 years46 gNone set
Males 14–18 years52 gNone set
Children 15 years, femaleNone set47.9 g
Children 15 years, maleNone set56.4 g
Children 16 years, femaleNone set47.4 g
Children 16 years, maleNone set55.8 g
Children 17 years, femaleNone set46.8 g
Children 17 years, maleNone set55.1 g
Adults 18+ years, femaleNone set48.6 g
Adults 18+ years, maleNone set56.5 g
Females 19+ years46 gNone set
Males 19+ years56 gNone set
Pregnancy 14–18 years71 gNone set
PregnancyNone set76.6 g
Pregnancy 19–30 years71 gNone set
Pregnancy 31–50 years71 gNone set
Lactation 14–18 years71 gNone set
LactationNone set67.6 g
Lactation 19–30 years71 gNone set
Lactation 31–50 years71 gNone set

EU and US age bands differ; "None set" means that body sets no value for the group. Label reference: FDA Daily Value 50 g, EU Reference Intake 50 g.EU and US age bands differ; "None set" means that body sets no value for the group. Label reference: EU Reference Intake 50 g, FDA Daily Value 50 g.

Foods high in protein

Per serving. Bars show the share of the Daily Value (50 g a day).

Per 100 g. Bars show the share of the Daily Value (50 g a day).

Per serving. Bars show the share of the EU Reference Intake (50 g a day).

Per 100 g. Bars show the share of the EU Reference Intake (50 g a day).

Per 100 kcal: the same calories of each food, for a fair comparison. Bars compare each food with the top food.

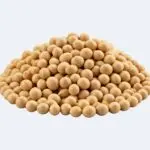
  1. 1.SoybeansBeans and Legumes · per 1 cup (172 g)31.3 g63% of the Daily Value63% of the Reference Intake
  2. 2.Chicken breastPoultry and Meats · per 4 oz (113 g)25.4 g51% of the Daily Value51% of the Reference Intake
  3. 3.Chicken drumstickPoultry and Meats · per 1 drumstick with skin (133 g)24 g48% of the Daily Value48% of the Reference Intake
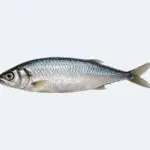
  4. 4.SardinesSeafood · per 1 can (92 g)22.7 g45% of the Daily Value45% of the Reference Intake
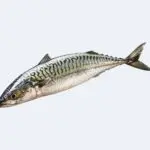
  5. 5.MackerelSeafood · per 1 fillet (112 g)20.8 g42% of the Daily Value42% of the Reference Intake
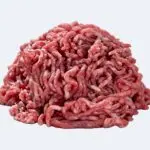
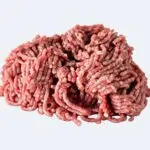
  6. 6.Ground beefPoultry and Meats · per 4 oz (113 g)19.4 g39% of the Daily Value39% of the Reference Intake
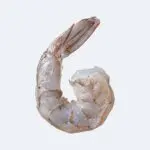
  7. 7.ShrimpSeafood · per 3 oz (85 g)19.4 g39% of the Daily Value39% of the Reference Intake
  8. 8.Ground lambPoultry and Meats · per 4 oz (113 g)18.7 g37% of the Daily Value37% of the Reference Intake
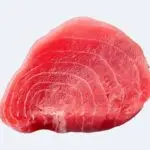
  9. 9.TunaSeafood · per 3 oz (85 g)18.7 g37% of the Daily Value37% of the Reference Intake
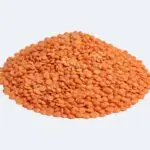
  10. 10.LentilsBeans and Legumes · per 1 cup (198 g)17.9 g36% of the Daily Value36% of the Reference Intake
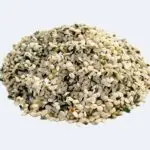
  1. 1.Hemp seedsNuts and Seeds31.6 g63% of the Daily Value63% of the Reference Intake
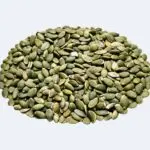
  2. 2.Pumpkin seedsNuts and Seeds30.2 g60% of the Daily Value60% of the Reference Intake
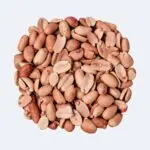
  3. 3.PeanutsNuts and Seeds25.8 g52% of the Daily Value52% of the Reference Intake
  4. 4.SardinesSeafood24.6 g49% of the Daily Value49% of the Reference Intake
  5. 5.ShrimpSeafood22.8 g46% of the Daily Value46% of the Reference Intake
  6. 6.Chicken breastPoultry and Meats22.5 g45% of the Daily Value45% of the Reference Intake
  7. 7.TunaSeafood22 g44% of the Daily Value44% of the Reference Intake
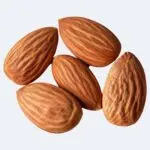
  8. 8.AlmondsNuts and Seeds21.2 g42% of the Daily Value42% of the Reference Intake
  9. 9.Sunflower seedsNuts and Seeds20.8 g42% of the Daily Value42% of the Reference Intake
  10. 10.Farmed Atlantic SalmonSeafood20.4 g41% of the Daily Value41% of the Reference Intake
  1. 1.CodSeafood21.7 g
  2. 2.TunaSeafood21.4 g
  3. 3.ShrimpSeafood19.1 g
  4. 4.Chicken breastPoultry and Meats18.8 g
  5. 5.ScallopsSeafood17.5 g
  6. 6.White mushroomsVegetables14 g
  7. 7.Wild Atlantic SalmonSeafood14 g
  8. 8.BasilHerbs and spices13.7 g
  9. 9.SpinachVegetables12.4 g
  10. 10.SardinesSeafood11.8 g