
Your feed has a number for you: one gram of protein per pound of body weight. The trend is called protein maxxing, and the idea is simple. If some is good, more must be better.
The official number is smaller. The US Recommended Dietary Allowance (RDA) is 0.8 grams per kilogram of body weight a day, which is 56 g for a 70 kg (154 lb) adult: a little over two raw 4 oz chicken breasts, at 25.4 g each [2]. A gram per pound means 154 g for the same adult, about six breasts.
So who is right? Partly both. The RDA is a floor, the least that keeps you from losing body protein, not a target for building muscle or aging well. In people who lift weights, extra protein helps up to about 1.6 g/kg and then the gains stop. Older adults are advised to eat more than younger ones. Here is the evidence, the foods that get you there, and the point where extra protein stops paying off.
How much protein do you actually need?
The RDA is a safety line, not a finish line. It was worked out to estimate the minimum protein you must eat to avoid losing body nitrogen, and the adult value of 0.8 g/kg has barely moved in more than 70 years (Wolfe et al., 2017).
On our proteins page [1], the US RDA is 46 g a day for women and 56 g for men aged 19 and up, and the label Daily Value is 50 g. Your own figure is your weight in kilograms (pounds divided by 2.2) times 0.8. Most people clear it without trying.
US adults aged 19 to 30 eat 88 g of protein a day on average, and the average of every group sat above the minimum
Cross-sectional analysis of the US National Health and Nutrition Examination Survey, 2001 to 2014. Intake per kilogram of ideal body weight ran from 1.10 g in adults aged 71 and older to 1.32 g in Asian and Hispanic adults.
Drawn to scale. Intake per kg of ideal (not actual) body weight, so the RDA comparison is approximate. Groups other than 71+ are adults 19 and older. Data: Berryman et al., 2018.
Eat a protein food at most meals and you are probably over the line already. The better question is whether more would buy you anything, and that is what the trials ask.
Does more protein build more muscle?
A little, if you also train. The two main meta-analyses share authors, several with dairy or beef funding, which the cards note. Both pool randomized trials, the strongest design for the question.
Extra protein during weight training added 0.30 kg of fat-free mass, with no further gain beyond 1.62 g/kg a day
Meta-analysis of 49 randomized trials with 1,863 adults who trained with weights for at least 6 weeks. Strength on the one-repetition-max test rose 2.49 kg more. One author reports grants and fees from the US National Dairy Council, which also supported trials in the analysis.
Eating more protein gave small extra gains in lean mass in 62 studies of people lifting weights
Meta-analysis of 74 randomized trials in healthy, non-obese adults, most testing extra protein during resistance training. The effect was significant in people 65 and older at 1.2 to 1.59 g/kg a day and in younger people at 1.6 g/kg or more. The authors rated the lean mass evidence moderate and the strength evidence low. Some authors report ties to dairy, beef and food companies.
That 0.30 kg is about two thirds of a pound: real, and modest. Line up the trials, the expert groups and the RDA, and a ladder appears.
Drawn to scale. Grams for 70 kg are our arithmetic. Sources: Wolfe 2017, PROT-AGE, ESPEN, Phillips 2016, Morton 2018.
The top rung is a trial result. The middle ones are expert advice, plus a 2016 review that called 1.2 to 1.6 g/kg a more ideal target than the RDA for adults seeking better health. If you lift and want the most from it, aim near 1.6 g/kg, which is 112 g at 70 kg, a little over four of those raw chicken breasts. If you do not train, these trials say little about extra protein for you.
Do you need more protein as you get older?
Expert groups say yes. The PROT-AGE group recommends that people over 65 eat at least 1.0 to 1.2 g/kg a day, at least 1.2 g/kg if they exercise, and 1.2 to 1.5 g/kg with an acute or chronic disease (Bauer et al., 2013). The European ESPEN group landed on the same ranges (Deutz et al., 2014).
Healthy older men needed 0.40 g/kg of protein in a meal to reach the plateau of muscle protein synthesis, against 0.24 g/kg in younger men
Retrospective analysis of lab studies that measured muscle protein synthesis in healthy older men (about 71 years) and younger men (about 22 years) after protein meals of different sizes. The gap per kilogram of body mass was borderline (p = .055). It measured a short-term response, not muscle gained over time.
Adults aged 70 to 79 in the top fifth of protein intake lost about 40% less lean mass over 3 years than those in the bottom fifth
Cohort of 2,066 men and women in the Health ABC Study, with protein from a food frequency questionnaire and lean mass from DXA scans. The top group lost 0.50 kg, the bottom group 0.88 kg, after adjusting for confounders. An association, not proof that protein caused the difference.
One exception from PROT-AGE: older adults with severe kidney disease who are not on dialysis may need to limit protein, and should follow their doctor’s advice.
Over 65, start at 1.0 to 1.2 g/kg (70 to 84 g at 70 kg), go higher with exercise or illness, and pair it with strength training, which is what most of the trials used.
Does it matter when you eat protein?
In many countries protein intake is skewed toward dinner, with a protein-light breakfast, as the authors of one small crossover trial note. They asked whether that costs muscle.
Spreading protein evenly over three meals raised muscle protein synthesis over 24 hours 25% compared with a dinner-heavy day
Randomized crossover feeding study in 8 healthy adults (average age 37). Each ate about 90 to 94 g of protein a day for a week, either evenly (about 30 g per meal) or mostly at dinner (63 g), with 30 days between diets. Muscle biopsies showed 0.075 against 0.056% per hour. It measured synthesis, not muscle gained. Two authors report speaking fees from the National Cattlemen’s Beef Association.
Drawn to scale. Means of 8 adults. Data: Mamerow et al., 2014.
Eight people for a week is a small base, and PROT-AGE says the evidence on timing is not yet enough for specific advice. The per-meal lab data agree in spirit: the plateau of 0.24 g/kg in younger men and 0.40 g/kg in older men is about 17 g and 28 g for a 70 kg man (our arithmetic).
Cheap experiment: if breakfast is toast and coffee, move some protein there, which is what the trial tested. Roughly 20 to 30 g per meal is a sensible range, not a rule.
What does 30 grams of protein look like?
A gram is hard to picture, so here is 30 g, a round amount for one meal. The bars show how much of each food holds it, and what that costs in calories (our arithmetic on the USDA values on each food page [2]).
Drawn to scale. Chicken is raw weight; soybeans and lentils are cooked. Data: USDA FoodData Central via NutriScrolls, our arithmetic.
It takes 122 g of sardines or 133 g of raw chicken breast, but about 3.7 cups of milk. Calories vary more, from 160 kcal in the chicken to 821 kcal in almonds, a fine food and a pricey way to hit a protein target. A dozen eggs holds about 76 g (12 times 6.3 g). Of the foods in the chart, only a cup of cooked soybeans reaches 30 g in one household measure.
Here is the live ranking per serving from our protein page.
Per serving. Bars show the share of the Daily Value (50 g a day).
Per 100 g. Bars show the share of the Daily Value (50 g a day).
Per serving. Bars show the share of the EU Reference Intake (50 g a day).
Per 100 g. Bars show the share of the EU Reference Intake (50 g a day).
Per 100 kcal: the same calories of each food, for a fair comparison. Bars compare each food with the top food.
- 1.
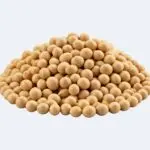
- 2.

- 3.

- 4.
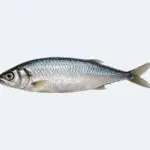
- 5.
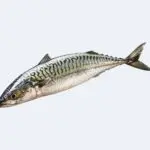
- 6.
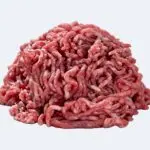
- 7.

- 8.
- 9.
- 10.


- 1.
- 2.
- 3.
- 4.
- 5.
- 6.
- 7.
- 8.
- 9.
- 10.


- 1.

- 2.
- 3.
- 4.
- 5.

- 6.

- 7.
- 8.
- 9.
- 10.


Per calorie, the order changes, and lean fish and poultry lead.
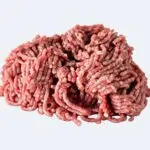
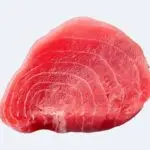
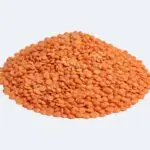
Drawn to scale. Foods chosen from our ranking, in the form each page uses (raw chicken, tuna, spinach, beef; cooked shrimp, lentils, soybeans). Data: USDA FoodData Central via NutriScrolls.
Spinach shows the catch. It has 12.4 g of protein per 100 kcal, but 100 kcal of raw spinach is about 435 g (15 oz), so nobody eats their way to 30 g with it. Nuts bring the most calories per gram of protein.
A day at 1.2 g/kg, which is 84 g for a 70 kg adult, could be three eggs at breakfast (18.9 g), a can of sardines at lunch (22.7 g), a cup of cooked lentils (17.9 g) and a raw 4 oz chicken breast at dinner (25.4 g). That adds up to 84.9 g.
Rule of thumb: choose foods by the amount you will really eat. A protein star you eat by the pinch does less than an ordinary food you eat by the plateful.
Does the source of protein matter?
Nine of the amino acids in protein are essential, so you must eat them (see our amino acid pages). Our completeness score compares each of the nine in a food, leucine among them, with a reference pattern from the Institute of Medicine [3]. The lowest ratio is the score, capped at 100.
Drawn to scale. Amino acid score against the Institute of Medicine pattern; it ignores digestibility. Data: USDA FoodData Central via NutriScrolls.
Chicken, eggs and cooked soybeans score 100. Lentils lose points on methionine plus cysteine, oats and almonds on lysine. The gaps are easy to fill: with equal protein from lentils and oats, our arithmetic puts lysine at about 109% and methionine plus cysteine at about 129% of the reference.
The score ignores digestion, which matters. In five people with ileostomies, 90.9% of cooked egg protein was digested, against 51.3% of raw egg protein (Evenepoel et al., 1998). For muscle itself, one meta-analysis compared the sources directly.
Animal and plant protein gave similar changes in absolute lean mass and strength in 16 trials, though adults under 50 gained 0.41 kg more lean mass with animal protein
Systematic review of 18 articles, 16 of them in the meta-analysis of randomized trials. Animal protein favored percent lean mass, and training made no difference to the result. The authors conclude that animal protein tends to be more beneficial for lean mass, especially in younger adults, and report no conflict of interest.
Beyond muscle, a meta-analysis of 31 cohort studies found that an extra 3% of energy from plant protein went with a 5% lower risk of death from any cause. That is an association, not a test of swapping foods.
Mix it up: chicken, eggs and soybeans are complete on their own, and the lentil and oat sums show how plants can cover for each other.
Can you eat too much protein?
For healthy adults the best-tested worry is the kidneys, and one small trial pushed intake to an extreme.
In healthy adults, higher-protein diets did not change kidney function compared with lower-protein diets
Meta-analysis of 28 randomized trials with 1,358 adults without kidney disease. The change in glomerular filtration rate, a measure of kidney filtering, did not differ between diets (standardized difference 0.11, 95% CI -0.05 to 0.27). The authors note an unclear risk of selection bias.
Eating 4.4 g/kg of protein a day for 8 weeks changed no body composition measure in trained people
Randomized trial in 30 resistance-trained adults. The high-protein group ate 307 g a day on average against 138 g in the control group, and also ate more calories. Body weight, fat mass, fat-free mass and percent body fat did not change. A small, short trial.
That 307 g a day is about a dozen raw chicken breasts, and nothing moved. Past the point where gains stop, more protein does not buy more muscle, and in healthy people it has not been shown to harm the kidneys. The 2016 review above also found no evidence-based link between higher-protein diets and kidney disease or poorer bone health.
A simple way to pick your number
- Healthy adult who does not train: the RDA of 0.8 g/kg is the floor, and most people already eat more.
- Lifting regularly: 1.2 to 1.6 g/kg, with gains leveling off near 1.6.
- Over 65: at least 1.0 to 1.2 g/kg, more with exercise or illness.
- Kidney disease, pregnancy or another medical condition: ask your doctor or dietitian first.
Protein maxxing is right that the RDA is only a floor. It is wrong that more keeps paying: past about 1.6 g/kg, the trials found nothing left to gain.
Frequently asked questions
Is one gram of protein per pound of body weight too much?
It is more than trials show a benefit for. One gram per pound is 2.2 g/kg. In a meta-analysis of 49 trials, muscle gains from lifting leveled off at 1.62 g/kg a day. Higher intakes did not harm kidney function in healthy adults across 28 trials, so it is not shown to be harmful either. People with kidney disease should ask their doctor first.
Are high-protein diets bad for your kidneys?
Not in healthy adults, according to a meta-analysis of 28 randomized trials with 1,358 people. The change in glomerular filtration rate, a measure of kidney function, did not differ between higher-protein and lower-protein diets. The authors note a risk of selection bias in the trials. People with severe kidney disease may need to limit protein and should follow their doctor’s advice.
How much protein should you eat at each meal?
Lab studies found that muscle protein synthesis leveled off after about 0.24 g/kg of protein in a meal for younger men and 0.40 g/kg for older men. That is roughly 17 g and 28 g for a 70 kg man. A trial of evenly spread days used about 30 g per meal. Together they suggest roughly 20 to 30 g at each meal.
Is plant protein as good as animal protein for building muscle?
In a meta-analysis of 16 studies, animal and plant protein gave similar changes in absolute lean mass and strength. Animal protein did better on percent lean mass, and adults under 50 gained 0.41 kg more lean mass with it. Total intakes in the trials were generally above the RDA. Combining plant foods such as lentils and oats covers each other’s amino acid gaps.
How much protein do women need?
The US RDA is 0.8 g/kg for adults, which our protein page lists as 46 g a day for women aged 19 and older and 71 g in pregnancy or lactation. Women over 65 fall under the same older-adult advice as men, at least 1.0 to 1.2 g/kg. Pregnant or breastfeeding women should follow their clinician’s guidance.
Sources
- NutriScrolls. Proteins: recommended intake per day (US RDA, NASEM) and foods high in protein. nutriscrolls.com/proteins/. Accessed 24 Oct 2026.
- U.S. Department of Agriculture, Agricultural Research Service. FoodData Central, entries used on NutriScrolls: chicken breast, raw (FDC 171077); eggs (FDC 171287); lentils, cooked (FDC 172421); soybeans, cooked (FDC 174271); sardines (FDC 175139); milk, 2% (FDC 172205); almonds (FDC 170567); shrimp (FDC 175180); tuna, skipjack (FDC 175156); spinach, raw (FDC 168462); peanuts (FDC 172430); ground beef, raw (FDC 174036). fdc.nal.usda.gov. Accessed 24 Oct 2026.
- Institute of Medicine. Dietary Reference Intakes for Energy, Carbohydrate, Fiber, Fat, Fatty Acids, Cholesterol, Protein, and Amino Acids. Washington, DC: National Academies Press; 2005 (amino acid scoring pattern).
- Wolfe RR, Cifelli AM, Kostas G, Kim IY. Optimizing protein intake in adults: interpretation and application of the Recommended Dietary Allowance compared with the Acceptable Macronutrient Distribution Range. Adv Nutr. 2017;8(2):266-275. doi:10.3945/an.116.013821
- Berryman CE, Lieberman HR, Fulgoni VL 3rd, Pasiakos SM. Protein intake trends and conformity with the Dietary Reference Intakes in the United States: analysis of the National Health and Nutrition Examination Survey, 2001-2014. Am J Clin Nutr. 2018;108(2):405-413. doi:10.1093/ajcn/nqy088
- Morton RW, Murphy KT, McKellar SR, et al. A systematic review, meta-analysis and meta-regression of the effect of protein supplementation on resistance training-induced gains in muscle mass and strength in healthy adults. Br J Sports Med. 2018;52(6):376-384. doi:10.1136/bjsports-2017-097608
- Nunes EA, Colenso-Semple L, McKellar SR, et al. Systematic review and meta-analysis of protein intake to support muscle mass and function in healthy adults. J Cachexia Sarcopenia Muscle. 2022;13(2):795-810. doi:10.1002/jcsm.12922
- Phillips SM, Chevalier S, Leidy HJ. Protein “requirements” beyond the RDA: implications for optimizing health. Appl Physiol Nutr Metab. 2016;41(5):565-572. doi:10.1139/apnm-2015-0550
- Bauer J, Biolo G, Cederholm T, et al. Evidence-based recommendations for optimal dietary protein intake in older people: a position paper from the PROT-AGE Study Group. J Am Med Dir Assoc. 2013;14(8):542-559. doi:10.1016/j.jamda.2013.05.021
- Deutz NE, Bauer JM, Barazzoni R, et al. Protein intake and exercise for optimal muscle function with aging: recommendations from the ESPEN Expert Group. Clin Nutr. 2014;33(6):929-936. doi:10.1016/j.clnu.2014.04.007
- Moore DR, Churchward-Venne TA, Witard O, et al. Protein ingestion to stimulate myofibrillar protein synthesis requires greater relative protein intakes in healthy older versus younger men. J Gerontol A Biol Sci Med Sci. 2015;70(1):57-62. doi:10.1093/gerona/glu103
- Houston DK, Nicklas BJ, Ding J, et al. Dietary protein intake is associated with lean mass change in older, community-dwelling adults: the Health, Aging, and Body Composition (Health ABC) Study. Am J Clin Nutr. 2008;87(1):150-155. doi:10.1093/ajcn/87.1.150
- Mamerow MM, Mettler JA, English KL, et al. Dietary protein distribution positively influences 24-h muscle protein synthesis in healthy adults. J Nutr. 2014;144(6):876-880. doi:10.3945/jn.113.185280
- Evenepoel P, Geypens B, Luypaerts A, et al. Digestibility of cooked and raw egg protein in humans as assessed by stable isotope techniques. J Nutr. 1998;128(10):1716-1722. doi:10.1093/jn/128.10.1716
- Lim MT, Pan BJ, Toh DWK, Sutanto CN, Kim JE. Animal protein versus plant protein in supporting lean mass and muscle strength: a systematic review and meta-analysis of randomized controlled trials. Nutrients. 2021;13(2):661. doi:10.3390/nu13020661
- Naghshi S, Sadeghi O, Willett WC, Esmaillzadeh A. Dietary intake of total, animal, and plant proteins and risk of all cause, cardiovascular, and cancer mortality: systematic review and dose-response meta-analysis of prospective cohort studies. BMJ. 2020;370:m2412. doi:10.1136/bmj.m2412
- Devries MC, Sithamparapillai A, Brimble KS, Banfield L, Morton RW, Phillips SM. Changes in kidney function do not differ between healthy adults consuming higher- compared with lower- or normal-protein diets: a systematic review and meta-analysis. J Nutr. 2018;148(11):1760-1775. doi:10.1093/jn/nxy197
- Antonio J, Peacock CA, Ellerbroek A, Fromhoff B, Silver T. The effects of consuming a high protein diet (4.4 g/kg/d) on body composition in resistance-trained individuals. J Int Soc Sports Nutr. 2014;11:19. doi:10.1186/1550-2783-11-19
Not medical advice
This article is general information, not a diagnosis or treatment. Talk to a doctor or registered dietitian before changing your diet, especially if you are pregnant, take medication or have a health condition. Read our medical disclaimer.


