Foods High in Vitamin E

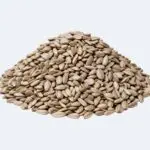
Which foods have the most vitamin E? Top of the list is Sunflower seeds at 35.2 mg per 100 g. Compare 113 foods per serving, per 100 g and per 100 kcal.

Foods high in vitamin E

Per serving. Bars show the share of the Daily Value (15 mg a day).

Per 100 g. Bars show the share of the Daily Value (15 mg a day). The line marks 100%.

Per serving. Bars show the share of the EU Reference Intake (12 mg a day).

Per 100 g. Bars show the share of the EU Reference Intake (12 mg a day). The line marks 100%.

Per 100 kcal: the same calories of each food, for a fair comparison. Bars compare each food with the top food.

  1. 1.Sunflower seedsNuts and Seeds · per 1 oz (28 g)9.97 mg66% of the Daily Value83% of the Reference Intake
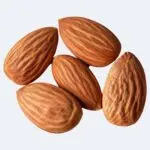
  2. 2.AlmondsNuts and Seeds · per 1 oz (28 g)7.27 mg48% of the Daily Value61% of the Reference Intake
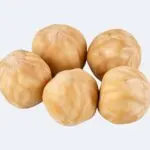
  3. 3.HazelnutsNuts and Seeds · per 1 oz (28 g)4.26 mg28% of the Daily Value36% of the Reference Intake
  4. 4.Farmed Atlantic SalmonSeafood · per 3 oz (85 g)3.02 mg20% of the Daily Value25% of the Reference Intake
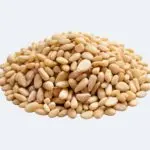
  5. 5.Pine nutsNuts and Seeds · per 1 oz (28 g)2.65 mg18% of the Daily Value22% of the Reference Intake
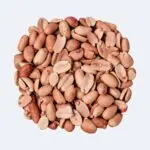
  6. 6.PeanutsNuts and Seeds · per 1 oz (28 g)2.36 mg16% of the Daily Value20% of the Reference Intake
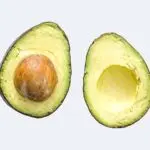
  7. 7.AvocadosFruits · per ½ avocado (101 g)2.08 mg14% of the Daily Value17% of the Reference Intake
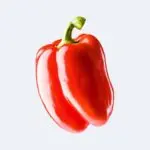
  8. 8.Bell peppersVegetables · per 1 medium (119 g)1.88 mg13% of the Daily Value16% of the Reference Intake
  9. 9.SardinesSeafood · per 1 can (92 g)1.88 mg13% of the Daily Value16% of the Reference Intake
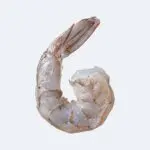
  10. 10.ShrimpSeafood · per 3 oz (85 g)1.87 mg12% of the Daily Value16% of the Reference Intake
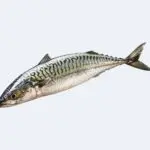
  11. 11.MackerelSeafood · per 1 fillet (112 g)1.7 mg11% of the Daily Value14% of the Reference Intake
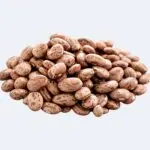
  12. 12.Pinto beansBeans and Legumes · per 1 cup (171 g)1.61 mg11% of the Daily Value13% of the Reference Intake
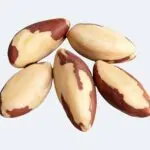
  13. 13.Brazil nutsNuts and Seeds · per 1 oz (28 g)1.6 mg11% of the Daily Value13% of the Reference Intake
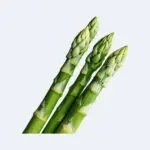
  14. 14.AsparagusVegetables · per 1 cup (134 g)1.51 mg10% of the Daily Value13% of the Reference Intake
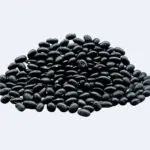
  15. 15.Black beansBeans and Legumes · per 1 cup (172 g)1.5 mg10% of the Daily Value12% of the Reference Intake
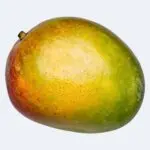
  16. 16.MangoFruits · per 1 cup (165 g)1.49 mg10% of the Daily Value12% of the Reference Intake
  17. 17.Sweet potatoesVegetables · per 1 medium (151 g)1.42 mg9% of the Daily Value12% of the Reference Intake
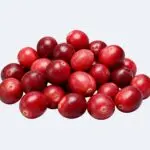
  18. 18.CranberriesFruits · per 1 cup (100 g)1.32 mg9% of the Daily Value11% of the Reference Intake
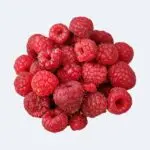
  19. 19.RaspberriesFruits · per 1 cup (123 g)1.07 mg7% of the Daily Value9% of the Reference Intake
  20. 20.QuinoaGrains · per ¼ cup (43 g)1.04 mg7% of the Daily Value9% of the Reference Intake
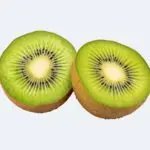
  21. 21.KiwifruitFruits · per 1 fruit (69 g)1.01 mg7% of the Daily Value8% of the Reference Intake
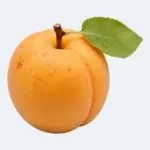
  22. 22.ApricotsFruits · per 3 apricots (105 g)0.93 mg6% of the Daily Value8% of the Reference Intake
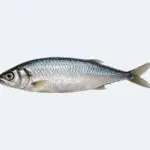
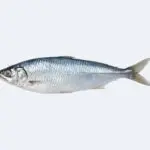
  23. 23.HerringSeafood · per 3 oz (85 g)0.91 mg6% of the Daily Value8% of the Reference Intake
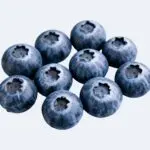
  24. 24.BlueberriesFruits · per 1 cup (148 g)0.84 mg6% of the Daily Value7% of the Reference Intake
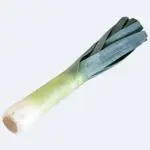
  25. 25.LeeksVegetables · per 1 leek (89 g)0.82 mg5% of the Daily Value7% of the Reference Intake
  1. 1.Sunflower seedsNuts and Seeds35.2 mg234% of the Daily Value293% of the Reference Intake
  2. 2.AlmondsNuts and Seeds25.6 mg171% of the Daily Value214% of the Reference Intake
  3. 3.HazelnutsNuts and Seeds15 mg100% of the Daily Value125% of the Reference Intake
  4. 4.Pine nutsNuts and Seeds9.33 mg62% of the Daily Value78% of the Reference Intake
  5. 5.PeanutsNuts and Seeds8.33 mg56% of the Daily Value69% of the Reference Intake
  6. 6.Brazil nutsNuts and Seeds5.65 mg38% of the Daily Value47% of the Reference Intake
  7. 7.Farmed Atlantic SalmonSeafood3.55 mg24% of the Daily Value30% of the Reference Intake
  8. 8.Pistachio nutsNuts and Seeds2.86 mg19% of the Daily Value24% of the Reference Intake
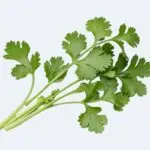
  9. 9.CorianderHerbs and spices2.5 mg17% of the Daily Value21% of the Reference Intake
  10. 10.QuinoaGrains2.44 mg16% of the Daily Value20% of the Reference Intake
  11. 11.ShrimpSeafood2.2 mg15% of the Daily Value18% of the Reference Intake
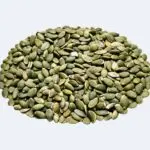
  12. 12.Pumpkin seedsNuts and Seeds2.18 mg15% of the Daily Value18% of the Reference Intake
  13. 13.AvocadosFruits2.07 mg14% of the Daily Value17% of the Reference Intake
  14. 14.SardinesSeafood2.04 mg14% of the Daily Value17% of the Reference Intake
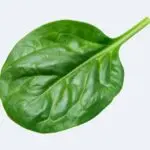
  15. 15.SpinachVegetables2.03 mg14% of the Daily Value17% of the Reference Intake
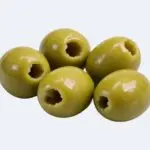
  16. 16.OlivesFruits1.65 mg11% of the Daily Value14% of the Reference Intake
  17. 17.Bell peppersVegetables1.58 mg11% of the Daily Value13% of the Reference Intake
  18. 18.MackerelSeafood1.52 mg10% of the Daily Value13% of the Reference Intake
  19. 19.KiwifruitFruits1.46 mg10% of the Daily Value12% of the Reference Intake
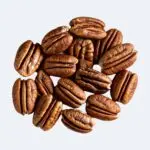
  20. 20.PecansNuts and Seeds1.4 mg9% of the Daily Value12% of the Reference Intake
  21. 21.CranberriesFruits1.32 mg9% of the Daily Value11% of the Reference Intake
  22. 22.AsparagusVegetables1.13 mg8% of the Daily Value9% of the Reference Intake
  23. 23.HerringSeafood1.07 mg7% of the Daily Value9% of the Reference Intake
  24. 24.EggsEggs and Dairy1.05 mg7% of the Daily Value9% of the Reference Intake
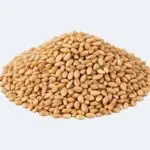
  25. 25.WheatGrains1.01 mg7% of the Daily Value8% of the Reference Intake
  1. 1.CorianderHerbs and spices10.9 mg
  2. 2.SpinachVegetables8.83 mg
  3. 3.Bell peppersVegetables6.08 mg
  4. 4.Sunflower seedsNuts and Seeds6.02 mg
  5. 5.AsparagusVegetables5.65 mg
  6. 6.AlmondsNuts and Seeds4.43 mg
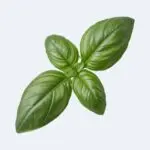
  7. 7.BasilHerbs and spices3.48 mg
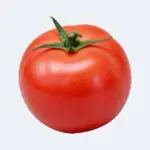
  8. 8.TomatoesVegetables3 mg
  9. 9.CranberriesFruits2.87 mg
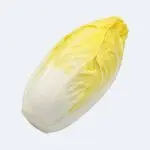
  10. 10.EndiveVegetables2.59 mg
  11. 11.KiwifruitFruits2.39 mg
  12. 12.HazelnutsNuts and Seeds2.39 mg
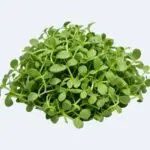
  13. 13.Garden cressVegetables2.19 mg
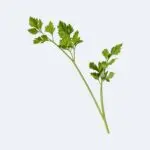
  14. 14.ParsleyHerbs and spices2.08 mg
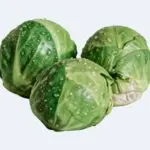
  15. 15.Brussels sproutsVegetables2.05 mg
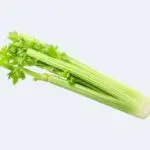
  16. 16.CeleryVegetables1.93 mg
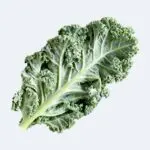
  17. 17.KaleVegetables1.89 mg
  18. 18.ApricotsFruits1.85 mg
  19. 19.ShrimpSeafood1.85 mg
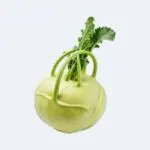
  20. 20.KohlrabiVegetables1.78 mg
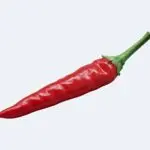
  21. 21.Chili peppersHerbs and spices1.73 mg
  22. 22.ArugulaVegetables1.72 mg
  23. 23.Farmed Atlantic SalmonSeafood1.71 mg
  24. 24.RaspberriesFruits1.67 mg
  25. 25.CarrotsVegetables1.61 mg

Draft: content follows in phase 4.