Foods Low in Iron

Lowest in iron: Coffee (0.02 mg in 1 cup), then Green tea (0.05 mg in 1 cup). All 120 foods ranked from the lowest, per serving and per 100 g.

Researched and written with Claude, an AI by Anthropic. Every study is checked against PubMed.

Foods low in iron

Per serving, lowest first. Bars show the share of the Daily Value (18 mg a day).

Per 100 g, lowest first. Bars show the share of the Daily Value (18 mg a day).

Per serving, lowest first. Bars show the share of the EU Reference Intake (14 mg a day).

Per 100 g, lowest first. Bars show the share of the EU Reference Intake (14 mg a day).

Per 100 kcal: the same calories of each food, for a fair comparison. Bars compare each food with the highest food in this ranking.

Only foods with a measured value are ranked. Herbs and spices are left out: by the teaspoon they are low in almost everything. Servings differ in size, so a food can rank low per serving and high per 100 g. Check both.

  1. 1.CoffeeBeverages · per 1 cup (237 g)0.02 mg<1% of the Daily Value<1% of the Reference Intake
  2. 2.Green teaBeverages · per 1 cup (245 g)0.05 mg<1% of the Daily Value<1% of the Reference Intake
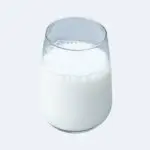
  3. 3.Semi-skimmed cows milkEggs and Dairy · per 1 cup (246 g)0.05 mg<1% of the Daily Value<1% of the Reference Intake
  4. 4.BeerBeverages · per 1 can (356 g)0.07 mg<1% of the Daily Value<1% of the Reference Intake
  5. 5.CeleryVegetables · per 1 stalk (40 g)0.08 mg<1% of the Daily Value<1% of the Reference Intake
  6. 6.HoneyMisc · per 1 tbsp (21 g)0.09 mg<1% of the Daily Value<1% of the Reference Intake
  7. 7.GrapefruitFruits · per ½ medium (128 g)0.12 mg<1% of the Daily Value<1% of the Reference Intake
  8. 8.OrangesFruits · per 1 fruit (131 g)0.13 mg<1% of the Daily Value<1% of the Reference Intake
  9. 9.GuavaFruits · per 1 fruit (55 g)0.14 mg<1% of the Daily Value1% of the Reference Intake
  10. 10.CarrotsVegetables · per 1 medium (61 g)0.18 mg1% of the Daily Value1% of the Reference Intake
  11. 11.EggplantVegetables · per 1 cup (82 g)0.19 mg1% of the Daily Value1% of the Reference Intake
  12. 12.KiwifruitFruits · per 1 fruit (69 g)0.21 mg1% of the Daily Value2% of the Reference Intake
  13. 13.ApplesFruits · per 1 medium (182 g)0.22 mg1% of the Daily Value2% of the Reference Intake
  14. 14.AcornsNuts and Seeds · per 1 oz (28 g)0.22 mg1% of the Daily Value2% of the Reference Intake
  15. 15.PlumsFruits · per 2 plums (132 g)0.22 mg1% of the Daily Value2% of the Reference Intake
  16. 16.CranberriesFruits · per 1 cup (100 g)0.23 mg1% of the Daily Value2% of the Reference Intake
  17. 17.OnionsVegetables · per 1 medium (110 g)0.23 mg1% of the Daily Value2% of the Reference Intake
  18. 18.MangoFruits · per 1 cup (165 g)0.26 mg1% of the Daily Value2% of the Reference Intake
  19. 19.ChestnutsNuts and Seeds · per 1 oz (28 g)0.27 mg1% of the Daily Value2% of the Reference Intake
  20. 20.RhubarbVegetables · per 1 cup (122 g)0.27 mg1% of the Daily Value2% of the Reference Intake
  21. 21.ShrimpSeafood · per 3 oz (85 g)0.27 mg2% of the Daily Value2% of the Reference Intake
  22. 22.Farmed Atlantic SalmonSeafood · per 3 oz (85 g)0.29 mg2% of the Daily Value2% of the Reference Intake
  23. 23.CucumbersVegetables · per 1 cup (104 g)0.29 mg2% of the Daily Value2% of the Reference Intake
  24. 24.ArugulaVegetables · per 1 cup (20 g)0.29 mg2% of the Daily Value2% of the Reference Intake
  25. 25.Iceberg lettuceVegetables · per 1 cup (72 g)0.3 mg2% of the Daily Value2% of the Reference Intake
  1. 1.CoffeeBeverages0.01 mg<1% of the Daily Value<1% of the Reference Intake
  2. 2.BeerBeverages0.02 mg<1% of the Daily Value<1% of the Reference Intake
  3. 3.Green teaBeverages0.02 mg<1% of the Daily Value<1% of the Reference Intake
  4. 4.Semi-skimmed cows milkEggs and Dairy0.02 mg<1% of the Daily Value<1% of the Reference Intake
  5. 5.GrapefruitFruits0.09 mg<1% of the Daily Value<1% of the Reference Intake
  6. 6.OrangesFruits0.1 mg<1% of the Daily Value<1% of the Reference Intake
  7. 7.ApplesFruits0.12 mg<1% of the Daily Value<1% of the Reference Intake
  8. 8.MangoFruits0.16 mg<1% of the Daily Value1% of the Reference Intake
  9. 9.PlumsFruits0.17 mg<1% of the Daily Value1% of the Reference Intake
  10. 10.PearsFruits0.18 mg1% of the Daily Value1% of the Reference Intake
  11. 11.CeleryVegetables0.2 mg1% of the Daily Value1% of the Reference Intake
  12. 12.CantaloupeFruits0.21 mg1% of the Daily Value2% of the Reference Intake
  13. 13.OnionsVegetables0.21 mg1% of the Daily Value2% of the Reference Intake
  14. 14.RhubarbVegetables0.22 mg1% of the Daily Value2% of the Reference Intake
  15. 15.CranberriesFruits0.23 mg1% of the Daily Value2% of the Reference Intake
  16. 16.EggplantVegetables0.23 mg1% of the Daily Value2% of the Reference Intake
  17. 17.WatermelonFruits0.24 mg1% of the Daily Value2% of the Reference Intake
  18. 18.PapayaFruits0.25 mg1% of the Daily Value2% of the Reference Intake
  19. 19.BananasFruits0.26 mg1% of the Daily Value2% of the Reference Intake
  20. 20.GuavaFruits0.26 mg1% of the Daily Value2% of the Reference Intake
  21. 21.TomatoesVegetables0.27 mg2% of the Daily Value2% of the Reference Intake
  22. 22.BlueberriesFruits0.28 mg2% of the Daily Value2% of the Reference Intake
  23. 23.CucumbersVegetables0.28 mg2% of the Daily Value2% of the Reference Intake
  24. 24.PineappleFruits0.29 mg2% of the Daily Value2% of the Reference Intake
  25. 25.CarrotsVegetables0.3 mg2% of the Daily Value2% of the Reference Intake
  1. 1.Semi-skimmed cows milkEggs and Dairy0.04 mg
  2. 2.BeerBeverages0.05 mg
  3. 3.HoneyMisc0.14 mg
  4. 4.Farmed Atlantic SalmonSeafood0.16 mg
  5. 5.AcornsNuts and Seeds0.2 mg
  6. 6.OrangesFruits0.21 mg
  7. 7.White riceGrains0.22 mg
  8. 8.ApplesFruits0.23 mg
  9. 9.MangoFruits0.27 mg
  10. 10.ShrimpSeafood0.27 mg
  11. 11.GrapefruitFruits0.28 mg
  12. 12.BananasFruits0.29 mg
  13. 13.Chicken breastPoultry and Meats0.31 mg
  14. 14.PearsFruits0.32 mg
  15. 15.DatesFruits0.32 mg
  16. 16.AvocadosFruits0.34 mg
  17. 17.PecansNuts and Seeds0.37 mg
  18. 18.Brazil nutsNuts and Seeds0.37 mg
  19. 19.PlumsFruits0.37 mg
  20. 20.GuavaFruits0.38 mg
  21. 21.Chicken drumstickPoultry and Meats0.44 mg
  22. 22.WalnutsNuts and Seeds0.44 mg
  23. 23.CodSeafood0.46 mg
  24. 24.ChestnutsNuts and Seeds0.48 mg
  25. 25.BlueberriesFruits0.49 mg

Who needs to limit iron?

In hemochromatosis the body absorbs too much iron from food. Doctors usually treat it by taking blood at regular times (phlebotomy), says the US institute NIDDK.

Most people with hemochromatosis do not need to change what they eat to lower their iron, NIDDK says, because diet has a small effect compared with phlebotomy. A doctor may advise avoiding iron supplements and vitamin C supplements, which raise iron absorption, and raw or undercooked shellfish.

What this ranking does not show

The amounts are the iron in the food, not the iron your body takes up. Iron from plant foods is harder to absorb than iron from other sources, says MedlinePlus.

Sources

  1. National Institute of Diabetes and Digestive and Kidney Diseases. Hemochromatosis. Jan 2020. Accessed 11 Nov 2026. https://www.niddk.nih.gov/health-information/liver-disease/hemochromatosis
  2. National Institute of Diabetes and Digestive and Kidney Diseases. Eating, Diet, & Nutrition for Hemochromatosis. Jan 2020. Accessed 11 Nov 2026. https://www.niddk.nih.gov/health-information/liver-disease/hemochromatosis/eating-diet-nutrition
  3. MedlinePlus, U.S. National Library of Medicine. Iron in diet. Reviewed 21 Jan 2025. Accessed 11 Nov 2026. https://medlineplus.gov/ency/article/002422.htm