Fruits Low in Potassium

Lowest in potassium: Olives (1.76 mg in 5 large olives), then Cranberries (80 mg in 1 cup). All 25 fruits ranked from the lowest.

Fruits low in potassium

Per serving, lowest first. Bars show the share of the Daily Value (4,700 mg a day).

Per 100 g, lowest first. Bars show the share of the Daily Value (4,700 mg a day).

Per serving, lowest first. Bars show the share of the EU Reference Intake (2,000 mg a day).

Per 100 g, lowest first. Bars show the share of the EU Reference Intake (2,000 mg a day).

Per 100 kcal: the same calories of each food, for a fair comparison. Bars compare each food with the highest food in this ranking.

Only foods with a measured value are ranked. Servings differ in size, so a food can rank low per serving and high per 100 g. Check both.

  1. 1.OlivesFruits · per 5 large olives (22 g)1.76 mg<1% of the Daily Value<1% of the Reference Intake
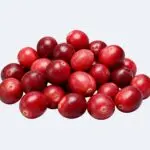
  2. 2.CranberriesFruits · per 1 cup (100 g)80 mg2% of the Daily Value4% of the Reference Intake
  3. 3.LemonsFruits · per 1 fruit (58 g)80 mg2% of the Daily Value4% of the Reference Intake
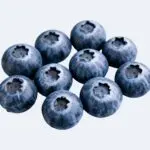
  4. 4.BlueberriesFruits · per 1 cup (148 g)114 mg2% of the Daily Value6% of the Reference Intake
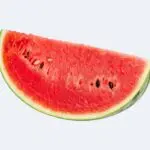
  5. 5.WatermelonFruits · per 1 cup (152 g)170 mg4% of the Daily Value9% of the Reference Intake
  6. 6.GrapefruitFruits · per ½ medium (128 g)178 mg4% of the Daily Value9% of the Reference Intake
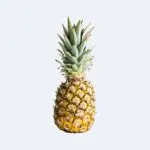
  7. 7.PineappleFruits · per 1 cup (165 g)180 mg4% of the Daily Value9% of the Reference Intake
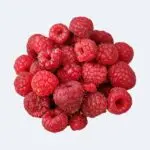
  8. 8.RaspberriesFruits · per 1 cup (123 g)186 mg4% of the Daily Value9% of the Reference Intake
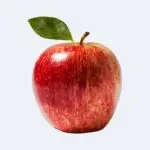
  9. 9.ApplesFruits · per 1 medium (182 g)195 mg4% of the Daily Value10% of the Reference Intake
  10. 10.PearsFruits · per 1 medium (178 g)206 mg4% of the Daily Value10% of the Reference Intake
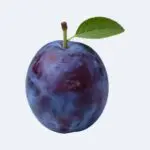
  11. 11.PlumsFruits · per 2 plums (132 g)207 mg4% of the Daily Value10% of the Reference Intake
  12. 12.KiwifruitFruits · per 1 fruit (69 g)215 mg5% of the Daily Value11% of the Reference Intake
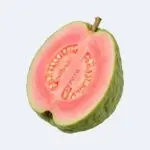
  13. 13.GuavaFruits · per 1 fruit (55 g)229 mg5% of the Daily Value11% of the Reference Intake
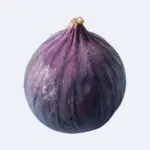
  14. 14.FigsFruits · per 2 medium figs (100 g)232 mg5% of the Daily Value12% of the Reference Intake
  15. 15.StrawberriesFruits · per 1 cup (152 g)233 mg5% of the Daily Value12% of the Reference Intake
  16. 16.OrangesFruits · per 1 fruit (131 g)237 mg5% of the Daily Value12% of the Reference Intake
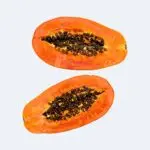
  17. 17.PapayaFruits · per 1 cup (145 g)264 mg6% of the Daily Value13% of the Reference Intake
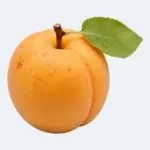
  18. 18.ApricotsFruits · per 3 apricots (105 g)272 mg6% of the Daily Value14% of the Reference Intake
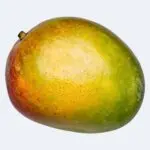
  19. 19.MangoFruits · per 1 cup (165 g)277 mg6% of the Daily Value14% of the Reference Intake
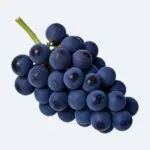
  20. 20.GrapesFruits · per 1 cup (151 g)288 mg6% of the Daily Value14% of the Reference Intake
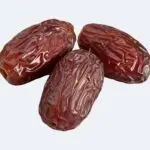
  21. 21.DatesFruits · per 2 dates (48 g)334 mg7% of the Daily Value17% of the Reference Intake
  22. 22.CherriesFruits · per 1 cup (154 g)342 mg7% of the Daily Value17% of the Reference Intake
  23. 23.BananasFruits · per 1 medium (118 g)422 mg9% of the Daily Value21% of the Reference Intake
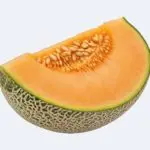
  24. 24.CantaloupeFruits · per 1 cup (160 g)427 mg9% of the Daily Value21% of the Reference Intake
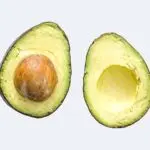
  25. 25.AvocadosFruits · per ½ avocado (101 g)487 mg10% of the Daily Value24% of the Reference Intake
  1. 1.OlivesFruits8 mg<1% of the Daily Value<1% of the Reference Intake
  2. 2.BlueberriesFruits77 mg2% of the Daily Value4% of the Reference Intake
  3. 3.CranberriesFruits80 mg2% of the Daily Value4% of the Reference Intake
  4. 4.ApplesFruits107 mg2% of the Daily Value5% of the Reference Intake
  5. 5.PineappleFruits109 mg2% of the Daily Value5% of the Reference Intake
  6. 6.WatermelonFruits112 mg2% of the Daily Value6% of the Reference Intake
  7. 7.PearsFruits116 mg2% of the Daily Value6% of the Reference Intake
  8. 8.LemonsFruits138 mg3% of the Daily Value7% of the Reference Intake
  9. 9.GrapefruitFruits139 mg3% of the Daily Value7% of the Reference Intake
  10. 10.RaspberriesFruits151 mg3% of the Daily Value8% of the Reference Intake
  11. 11.StrawberriesFruits153 mg3% of the Daily Value8% of the Reference Intake
  12. 12.PlumsFruits157 mg3% of the Daily Value8% of the Reference Intake
  13. 13.MangoFruits168 mg4% of the Daily Value8% of the Reference Intake
  14. 14.OrangesFruits181 mg4% of the Daily Value9% of the Reference Intake
  15. 15.PapayaFruits182 mg4% of the Daily Value9% of the Reference Intake
  16. 16.GrapesFruits191 mg4% of the Daily Value10% of the Reference Intake
  17. 17.CherriesFruits222 mg5% of the Daily Value11% of the Reference Intake
  18. 18.FigsFruits232 mg5% of the Daily Value12% of the Reference Intake
  19. 19.ApricotsFruits259 mg6% of the Daily Value13% of the Reference Intake
  20. 20.CantaloupeFruits267 mg6% of the Daily Value13% of the Reference Intake
  21. 21.KiwifruitFruits312 mg7% of the Daily Value16% of the Reference Intake
  22. 22.BananasFruits358 mg8% of the Daily Value18% of the Reference Intake
  23. 23.GuavaFruits417 mg9% of the Daily Value21% of the Reference Intake
  24. 24.AvocadosFruits485 mg10% of the Daily Value24% of the Reference Intake
  25. 25.DatesFruits696 mg15% of the Daily Value35% of the Reference Intake
  1. 1.OlivesFruits6.9 mg
  2. 2.BlueberriesFruits135 mg
  3. 3.CranberriesFruits174 mg
  4. 4.PearsFruits204 mg
  5. 5.ApplesFruits206 mg
  6. 6.PineappleFruits218 mg
  7. 7.DatesFruits251 mg
  8. 8.GrapesFruits277 mg
  9. 9.MangoFruits280 mg
  10. 10.RaspberriesFruits290 mg
  11. 11.AvocadosFruits303 mg
  12. 12.FigsFruits314 mg
  13. 13.PlumsFruits341 mg
  14. 14.CherriesFruits352 mg
  15. 15.WatermelonFruits373 mg
  16. 16.OrangesFruits385 mg
  17. 17.BananasFruits402 mg
  18. 18.PapayaFruits423 mg
  19. 19.GrapefruitFruits434 mg
  20. 20.LemonsFruits476 mg
  21. 21.StrawberriesFruits478 mg
  22. 22.KiwifruitFruits511 mg
  23. 23.ApricotsFruits540 mg
  24. 24.GuavaFruits613 mg
  25. 25.CantaloupeFruits785 mg