
Copper is an essential trace mineral. The NIH, the US National Institutes of Health, says enzymes called cuproenzymes need it. They use it to make energy, handle iron, build connective tissue and make nerve messengers. The body’s defense against oxidative damage depends mainly on the copper-containing superoxide dismutases (see antioxidants).
An adult body holds only 50 to 120 mg of copper, almost two-thirds of it in the skeleton and muscle. A carrier protein called ceruloplasmin holds more than 95% of the copper in blood plasma.
Most readers do not know how tightly the body steers its copper. In a 90-day study of 11 young men, the share absorbed was 55.6% on a low-copper diet (0.785 mg a day). It was 36.3% on an adequate one (1.68 mg) and 12.4% on a high one (7.53 mg).
Typical US diets meet or exceed the 900 mcg (microgram) allowance, and deficiency is uncommon. When it does happen, the causes are specific. They are stomach or bowel surgery, celiac disease, an inherited disorder called Menkes disease, and long-term high zinc intake, including zinc from some denture creams.
The evidence is lopsided. Deficiency is well documented in case series (reports on groups of patients). It causes anemia, low white blood cell counts and a spinal cord disease that can resemble vitamin B12 deficiency. Blood counts usually recover with copper.
Trials of copper supplements in healthy people are few and small. Studies of heart disease and Alzheimer’s disease disagree with each other. This page sets out what the studies show.
Health benefits of copper
The top findings from 27 studies, strongest evidence first
What the stars mean
- Strong. Several randomized trials, pooled in a meta-analysis, point the same way, or regulators (FDA or EFSA) have approved the claim.
- Moderate. Good randomized trials support it, but there are fewer of them, or their results vary.
- Limited. Small, short or single trials, or mixed results. Promising, but it needs confirmation.
Population and lab studies get no stars: they show a link or a mechanism, not proof.
How we rate evidence →- ★★★Eight approved EU health claimsThe EU allows copper claims such as normal connective tissues, nervous system and iron transport. They describe normal body function, not treatment.
- ★★Supplements did not change blood cholesterolIn 5 trials with 176 people, copper supplements did not clearly change total, LDL (“bad”) or HDL (“good”) cholesterol. A small effect cannot be ruled out.
- ★★Copper in drinking water upset stomachsIn 1,365 adults, water with 6 mg/L of copper caused more nausea, vomiting, diarrhea and stomach pain. In 60 women, nausea, pain or vomiting came at 3 mg/L or more.
- ★Copper supplement did not change thinking in Alzheimer’sIn 68 people with mild Alzheimer’s, a year of copper supplements (8 mg a day, as copper orotate) did not change thinking test scores. It was a small trial.
- ★Little change in heart-risk markers with copper supplementsIn middle-aged adults with moderately high cholesterol, 8 weeks of copper glycinate (2 mg of copper a day) did not clearly change cholesterol or homocysteine. In 16 healthy young women, 6 mg a day as copper sulfate cut PAI-1, a clotting-related factor, by about 30%.
All 24 studies, strongest evidence first
The EU allows eight copper claims, from iron transport to cell protection
Under Regulation (EU) No 432/2012, copper contributes to normal connective tissues, energy-yielding metabolism, nervous system, hair and skin pigmentation, and iron transport. It also contributes to normal immune function and protects cells from oxidative stress. A food may carry a claim only if it is at least a source of copper. Under EU labeling rules that is generally 15% of the 1 mg EU Reference Intake (0.15 mg) per 100 g. For drinks it is 7.5% per 100 ml. The claims rest on opinions from EFSA (the EU food safety agency) from 2009 and 2011, and describe normal body function, not treatment.
In five trials, copper supplements did not change blood cholesterol
This meta-analysis pooled 5 randomized trials with 176 participants. The standardized mean differences against control were -0.05 for total cholesterol, 0.22 for LDL (“bad”) and 0.18 for HDL (“good”) cholesterol. None was clear, and the ranges were wide, so a small effect cannot be ruled out. The authors call for more research.
Water with 6 mg/L of copper caused more stomach symptoms
This randomized, double-blind study gave 1,365 adults water with less than 0.01, 2, 4 or 6 mg/L of copper for 2 months. Nausea, vomiting, diarrhea and abdominal pain were more common at 6 mg/L than at the lowest level. Copper markers in a subgroup did not change, which the authors read as good regulation by the body. Liver tests stayed normal.
Copper water at 3 mg/L or more upset stomachs
In this randomized trial, 60 women in four groups of 15 each spent 2 weeks on every copper level, in a rotating order. The levels were no added copper, or 1, 3 or 5 mg/L as copper sulfate in tap water. Nausea, abdominal pain or vomiting came at rates of 5%, 2%, 17% and 15%, and most symptoms went away when the copper stopped. Diarrhea was not linked to the copper level, and the authors say larger studies are needed to set exact thresholds.
8 mg of copper did not change thinking in Alzheimer’s
In this randomized, double-blind phase 2 trial, 68 people with mild Alzheimer’s disease took copper daily or placebo (a dummy pill) for a year. The copper came as copper(II) orotate dihydrate. Scores on the Alzheimer’s Disease Assessment Scale (cognitive part) and the Mini Mental Status Examination did not differ between groups. It was well tolerated, and the authors conclude oral copper neither harmed nor helped, but this was a small pilot trial.
2 mg of copper raised two enzymes but not five heart markers
In this randomized trial, healthy middle-aged adults with moderately high cholesterol took copper glycinate or placebo for 8 weeks. The dose was 2 mg of copper a day, and red-cell superoxide dismutase 1 and plasma ceruloplasmin rose. C-reactive protein, homocysteine, and total, LDL and HDL cholesterol did not clearly change. Oxidized LDL fell, but the authors call that result inconsistent.
6 mg of copper cut PAI-1 about 30% in young women
These 16 healthy women, about 24 years old, had three 4-week periods with 0, 3 or 6 mg of copper a day. The copper came as copper sulfate, in random order, with 3-week breaks between periods. Serum copper and red-cell superoxide dismutase rose with 3 mg, with no further rise at 6 mg. PAI-1, a clotting-related factor, fell only at 6 mg, other markers and lipids were unchanged, and heart disease itself was not measured.
50 mg of zinc daily for 6 weeks lowered a copper enzyme
In this controlled trial, healthy men took two daily doses of 25 mg of zinc or placebo for 6 weeks. Plasma copper and ceruloplasmin (ferroxidase) activity did not differ between groups. Red-cell Cu,Zn-superoxide dismutase fell with zinc, and the gap became clear at 6 weeks, which the authors read as lower copper status. The abstract does not give the group sizes.
92% of 12 early-treated Menkes babies lived, against 13% treated late
Menkes disease is a fatal inherited disorder of infancy caused by mutations in the copper-transport gene ATP7A. Researchers screened 81 at-risk infants with blood tests, and 12 newborns began copper treatment within 22 days of birth. Survival was checked at a median of 4.6 years. They were compared with 15 late-diagnosed patients from the past (13% alive at a median of 1.8 years), not a randomized control. Two of the 12 had normal development, and both had mutations that left some ATP7A function.
In 40 copper-deficient patients, anemia and low white cells were most common
Of 40 patients in Mayo Clinic records from 1970 to 2005, one in four (10, or 25%) had weight-loss surgery. Another 14 (35%) had other stomach or bowel surgery, and in 12 no cause was found. Most also had myeloneuropathy, damage to the spinal cord and nerves. Bone marrow findings can look like myelodysplastic syndrome, so the authors stress that copper deficiency is uncommon but very treatable.
Copper deficiency caused a spinal cord disease like B12 deficiency
This Mayo Clinic case series covered 13 adults, who all had trouble walking from loss of position sense and leg stiffness. All had polyneuropathy (damage to many nerves), and a very low ceruloplasmin level was the first clue. Of 11 patients with data, 7 had a high or high-normal zinc level. Oral copper restored normal or near-normal levels in 7 of 12 patients followed and stopped further decline, but improvement in symptoms varied.
12 of 16 Scottish cases had high zinc; 9 used zinc fixatives
This national review looked back at all copper deficiency cases in Scotland over 5 years, and the fixatives were zinc-containing dental products. Blood problems were the first sign in 94% (anemia, low platelets, low infection-fighting white cells), and 75% had nerve symptoms or signs. After copper replacement and treatment of the cause, 93% of blood count problems responded. But only 25% of patients improved in nerve function, while 33% got worse and 42% stayed the same.
Four heavy denture-cream users got copper deficiency and nerve disease
This case series covered 4 denture wearers with low copper, high zinc and neurologic problems, caused by the zinc in the cream. Two creams tested held about 17,000 to 34,000 µg of zinc per gram. Serum zinc improved in three people after they stopped the cream, and copper supplements gave mild nerve improvement in two. Cases cannot show how often this happens.
Zinc excess caused copper deficiency in three men
This case report describes men aged 47, 21 and 42 with anemia and severe neutropenia, a lack of infection-fighting white cells. Two also had nerve damage that had worsened over 8 to 18 months. The 21-year-old was taking zinc for acrodermatitis enteropathica, a rare zinc-absorption disorder. A bone marrow sample first suggested copper deficiency, and further tests confirmed it and traced it to zinc excess.
Copper deficiency hit 16% to 28% of weight-loss surgery patients
This meta-analysis pooled 43 studies. Deficiency was 16% at 1 year, 28% at 2 years, 21% at 3 years and 16% at 4 years after surgery. It was more common after biliopancreatic diversion than after other operations. The authors call it an overlooked complication and urge follow-up and nutrition monitoring.
Highest copper levels went with 2.22 times the coronary heart disease risk
This meta-analysis pooled 37 studies of five metals and cardiovascular disease, with 348,259 participants in total. Comparing top and bottom thirds of baseline copper, the risk was 1.81 times for cardiovascular disease and 2.22 times for coronary heart disease. For stroke it was 1.29, a result that could be chance. The studies compared baseline copper levels and cannot show that copper caused the disease.
In Japan, the top fifth of copper intake had more cardiovascular deaths
This cohort followed 58,646 Japanese adults from 1989 to 2009, with 3,388 cardiovascular deaths, and measured intake by food questionnaire. Cardiovascular death risk was 1.63 times as high in men and 1.36 times in women. Copper intake was not linked to coronary heart disease deaths, but stroke deaths were higher in men (1.78) and women (1.49). The result does not show that dietary copper is harmful.
In China, more dietary copper went with higher death and heart risk
The PURE-China cohort followed 45,101 adults for 482,833 person-years, and mean dietary copper intake was 2.6 mg a day. People in the third and fourth quartiles, the upper half of intake, had higher risks than those in the first and second. That held for the combined outcome, death from any cause, cardiovascular death, major cardiovascular disease and stroke. The authors call for studies in populations with different diets.
In US adults, more dietary copper went with lower death risk
This NHANES cohort followed 39,784 US adults from 2001 to 2018, and the link with death from any cause was not a straight line. Against the lowest quartile, the risk was 0.91, 0.88 and 0.86 times for the second, third and fourth quartiles. Cardiovascular deaths followed a similar trend that could be chance. This points the opposite way from the Japanese and Chinese cohorts above.
Top-quarter serum copper had 2.87 times the coronary death risk
This analysis of the US NHANES II survey followed 4,574 adults through 1992, with 151 coronary heart disease deaths. It adjusted for age, sex, smoking, blood pressure, cholesterol and other factors. The risk was 1.84, 2.14 and 2.87 times for the second, third and fourth quartiles of serum copper. The author says it remains to be shown whether copper acts directly or marks inflammation.
People with Alzheimer’s had more copper in their blood
This meta-analysis covered studies published up to March 2013. For copper not bound to ceruloplasmin, 10 studies covered 599 patients and 867 controls. For total serum copper, 27 studies covered 1,393 patients and 2,159 controls. Every copper index, including unbound copper, was clearly higher in Alzheimer’s disease. These studies compare blood levels, so they cannot show whether copper plays a part in the disease or changes because of it.
In Alzheimer’s, serum copper was higher, but not spinal fluid copper
This meta-analysis of 26 studies compared 761 patients and 664 controls for serum, and 116 patients and 129 controls for spinal fluid. Plasma data were too variable to draw a conclusion. The authors describe earlier studies as giving conflicting results. A corrected version of this paper was republished in 2012.
With saturated and trans fat, high copper went with faster mental decline
This study tested 3,718 Chicago residents aged 65 and older on 4 thinking tests every 3 years for 6 years. In people eating a lot of saturated and trans fat, the top fifth of copper intake declined faster than the lowest group. Median intakes were 2.75 and 0.88 mg a day, and the authors equate the gap to 19 years of age. There was no link in people whose diets were not high in these fats, and questionnaire data cannot show cause.
More dietary copper went with slightly denser spine bone (0.02 g/cm²)
This meta-analysis of observational studies found the lumbar spine difference in three studies with 9,059 people. Four studies with 14,345 people gave the same 0.02 g/cm² difference for the hip, but it could be chance. The studies varied, and the authors point to copper’s role in collagen cross-linking. Intakes came from dietary questionnaires and similar tools, so the link may reflect other habits.
Foods high in copper
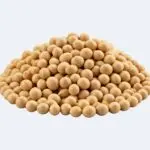
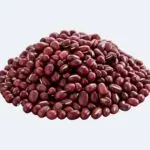
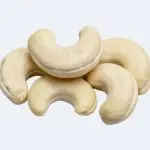
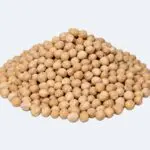
Oysters lead the per-serving ranking on this page: 3 oz (85 g) holds 1.34 mg. That is 149% of the 0.9 mg Daily Value, the FDA label amount, and 100 g holds 1.58 mg. Next per serving come soybeans (0.7 mg per cup), adzuki beans, cashews and chickpeas.
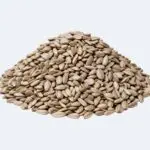
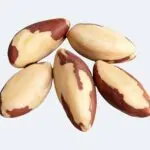
Per 100 g the order changes, because seeds and nuts are dense but eaten in small portions. Sesame seeds (4.08 mg) and cocoa powder (3.79 mg) lead, followed by cashews, sunflower seeds, Brazil nuts and hazelnuts. The ranking below has the full list.
The NIH lists higher values for some foods than our ranking shows. Pan-fried beef liver holds 12.4 mg in 3 oz (1,378% of the Daily Value), and cooked wild eastern oysters 4.85 mg in 3 oz. Unsweetened baking chocolate has 0.938 mg in 1 oz, a medium cooked potato 0.675 mg and cooked shiitake mushrooms 0.65 mg per half cup. Beef liver is not among the foods ranked here.
Copper in food varies with growing conditions and processing. Tap water adds a variable amount (0.0005 to 1 mg/L, the NIH says).
Copper from plant foods is absorbed well. In rats, copper from sunflower seeds, peanuts, cooked shrimp and cooked beef was absorbed as well as copper sulfate. In a 63-day study of men, phytate and fiber did not change absorption. High-dose zinc supplements, on the other hand, can block it.
Per serving. Bars show the share of the Daily Value (0.9 mg a day). The line marks 100%.
Per 100 g. Bars show the share of the Daily Value (0.9 mg a day). The line marks 100%.
Per serving. Bars show the share of the EU Reference Intake (1 mg a day). The line marks 100%.
Per 100 g. Bars show the share of the EU Reference Intake (1 mg a day). The line marks 100%.
Per 100 kcal: the same calories of each food, for a fair comparison. Bars compare each food with the top food.
- 1.

- 2.
- 3.
- 4.
- 5.
- 6.
- 7.
- 8.
- 9.

- 10.


- 1.
- 2.
- 3.
- 4.
- 5.
- 6.
- 7.
- 8.
- 9.
- 10.


- 1.
- 2.

- 3.
- 4.

- 5.
- 6.

- 7.
- 8.

- 9.
- 10.



Sources
- FoodData Central. US Department of Agriculture, Agricultural Research Service. Values as shown in the ranking above.
- Copper: fact sheet for health professionals. National Institutes of Health, Office of Dietary Supplements. Updated October 18, 2022.
- Johnson PE, Stuart MA, Bowman TD. Bioavailability of copper to rats from various foodstuffs and in the presence of different carbohydrates. Proc Soc Exp Biol Med. 1988.
- Turnlund JR, King JC, Gong B, Keyes WR, Michel MC. A stable isotope study of copper absorption in young men: effect of phytate and alpha-cellulose. Am J Clin Nutr. 1985.
- EFSA Panel on Food Additives and Nutrient Sources added to Food (ANS). Copper(II) oxide as a source of copper added for nutritional purposes to food supplements. EFSA J. 2009.
How copper works
Most of the biochemistry below is well established. But it comes from reviews, small isotope studies in people, and cell and animal work, not from trials of extra copper. Five ideas cover most of it.
Copper is built into enzymes, and the body tunes absorption to intake. The gut and liver pass it along, and two genes can fail. Copper lets iron move, and too much zinc blocks it. Here is each one, and what has been seen in people.
It is built into enzymes
Copper is a cofactor (a helper) for cuproenzymes, the NIH says. They work in energy production, iron metabolism, activating neuropeptides, building connective tissue and making neurotransmitters. Copper is also involved in blood vessel growth (angiogenesis), brain development, pigmentation and immune function. The body’s defense against oxidative damage depends mainly on the copper-containing superoxide dismutases.
That is why EU claims range from normal connective tissue and skin pigmentation to protection of cells from oxidative stress (see antioxidants). An excess of copper in cells can generate free radicals. So cells pass it on with chaperone proteins that deliver it to where it is used.
Four jobs of copper in the body. Not to scale. Based on the NIH fact sheet and a review of the copper enzymes that handle iron.
The body tunes absorption to how much you eat
Most copper is absorbed in the upper small intestine. A review puts absorption at 30% to 40% of the copper in typical diets of industrialized countries, through a carrier-mediated transport system. How much is absorbed depends strongly on how much is eaten.
In a 90-day isotope study of 11 young men, absorption fell from 55.6% on 0.785 mg a day to 36.3% on 1.68 mg. It was 12.4% on 7.53 mg. Most of the men reached copper balance on about 0.8 mg a day. The NIH describes the same pattern: about 75% at 400 mcg a day, falling to 12% at 7.5 mg a day.
Most copper leaves the body in bile, and total losses in the stool are about 1 mg a day.
Phytate holds back zinc, but it did not change copper absorption in a 63-day study of young men. Absorption was 35.0% from the basal diet, 31.4% with added phytate and 34.1% with added cellulose.
Share of dietary copper absorbed at three intakes by 11 young men in a 90-day stable-isotope study. Drawn to scale.
The gut and liver pass it along, and two genes can fail
Gut cells take in copper with a transporter called CTR1, and a pump called ATP7A moves it into the blood. In the liver, ATP7B puts copper onto ceruloplasmin for the blood or sends it into bile, according to a review of copper metabolism. Faults in these two pumps cause the two classic copper diseases.
Menkes disease is a rare X-linked recessive disorder caused by ATP7A mutations. Absorption of dietary copper drops sharply. The signs include failure to thrive, seizures and unusually kinky hair, and most children die by age 3 without treatment, the NIH says.
In Wilson disease, which is autosomal recessive, ATP7B mutations let copper pile up in the liver, brain and other organs. This causes liver disease and neurologic and psychiatric symptoms.
Both are treated by specialists. Copper injections started in the first weeks of life can improve survival in Menkes disease. Wilson disease is treated with chelation therapy (drugs that bind copper) or zinc salts, which reduce copper overload in different ways.
European liver guidelines note that no randomized trial in Wilson disease has had an optimal design, so advice rests on large case series. Neither disease is caused by diet, and people who have them need specialist care rather than the general advice on this page.
How copper moves through the gut and liver, and where Menkes and Wilson disease break the chain. Not to scale. The steps are from a review of copper metabolism.
It lets iron leave cells
Iron leaves cells through the exporter ferroportin as Fe2+, but transferrin, the main iron carrier in blood, binds Fe3+ much better. Three copper-containing enzymes known in humans turn one into the other: ceruloplasmin, hephaestin and zyklopen. Hephaestin in gut cells lets dietary iron into the blood, and the release of iron from the liver relies on ceruloplasmin.
This is one way copper deficiency can disturb how the body handles iron. In 4 patients with acquired copper deficiency and liver abnormalities, 2 had cirrhosis or advanced fibrosis. The other 2 had iron overload in the liver, which the authors tie to the loss of ceruloplasmin. These are case reports, so the frequency of this problem is unknown.
How copper enzymes help iron into the blood, and what happened to four patients without enough copper. Not to scale. The enzyme steps are from a review, the liver findings from case reports.
Too much zinc blocks it
High zinc intake can interfere with copper absorption, and excessive use of zinc supplements can lead to copper deficiency, the NIH says. In perfused rat intestine, very high zinc in the gut lowered copper in the intestinal cells and the copper passed on to the blood. High-zinc diets raised the copper bound to metallothionein.
In people, 50 mg of zinc a day for 6 weeks lowered a copper enzyme in healthy men. The NIH notes similar falls at about 60 mg a day for up to 10 weeks.
In case series, people with copper deficiency often had high blood zinc. In a Scottish review, 12 of 16 did, and 9 used zinc-containing dental fixatives. The NIH names this as one reason the US upper limit for zinc is 40 mg a day.
What has been seen in people
The clearest findings are about deficiency. In case series, too little copper caused anemia, low white blood cells and spinal cord disease. In a national Scottish review, 93% of the blood count problems responded, but only 25% improved in nerve function, so early treatment matters. In Menkes disease, early copper injections raised survival.
Outside deficiency the results are thin or conflicting. Small trials in healthy adults raised copper enzymes without moving cholesterol, and a meta-analysis of five trials found no effect on blood lipids. The one Alzheimer’s trial found no effect on thinking.
Observational studies of heart disease point both ways. The studies of blood copper in Alzheimer’s disease cannot say whether copper is a cause or a result. All of these are among the study cards above.
Sources
- Copper: fact sheet for health professionals. National Institutes of Health, Office of Dietary Supplements. Updated October 18, 2022.
- Turnlund JR, Keyes WR, Anderson HL, Acord LL. Copper absorption and retention in young men at three levels of dietary copper by use of the stable isotope 65Cu. Am J Clin Nutr. 1989.
- Turnlund JR, King JC, Gong B, Keyes WR, Michel MC. A stable isotope study of copper absorption in young men: effect of phytate and alpha-cellulose. Am J Clin Nutr. 1985.
- Wapnir RA. Copper absorption and bioavailability. Am J Clin Nutr. 1998.
- Chen J, Jiang Y, Shi H, Peng Y, Fan X, Li C. The molecular mechanisms of copper metabolism and its roles in human diseases. Pflugers Arch. 2020.
- Członkowska A, Litwin T, Dusek P, et al. Wilson disease. Nat Rev Dis Primers. 2018.
- European Association for Study of Liver. EASL Clinical Practice Guidelines: Wilson’s disease. J Hepatol. 2012.
- Kaler SG, Holmes CS, Goldstein DS, et al. Neonatal diagnosis and treatment of Menkes disease. N Engl J Med. 2008.
- Vashchenko G, MacGillivray RT. Multi-copper oxidases and human iron metabolism. Nutrients. 2013.
- Thackeray EW, Sanderson SO, Fox JC, Kumar N. Hepatic iron overload or cirrhosis may occur in acquired copper deficiency and is likely mediated by hypoceruloplasminemia. J Clin Gastroenterol. 2011.
- Oestreicher P, Cousins RJ. Copper and zinc absorption in the rat: mechanism of mutual antagonism. J Nutr. 1985.
- Fischer PW, Giroux A, L’Abbé MR. Effect of zinc supplementation on copper status in adult man. Am J Clin Nutr. 1984.
- Gabreyes AA, Abbasi HN, Forbes KP, McQuaker G, Duncan A, Morrison I. Hypocupremia associated cytopenia and myelopathy: a national retrospective review. Eur J Haematol. 2013.
How much copper do you need?
Adults need 900 mcg (0.9 mg) of copper a day in the US. That is the Recommended Dietary Allowance (RDA), which covers nearly all healthy people and is the same for men and women. EFSA sets adequate intakes of 1.6 mg a day for men and 1.3 mg for women.
Needs rise in pregnancy and breastfeeding. For ages 19 and older the US values are 1,000 mcg in pregnancy and 1,300 mcg while breastfeeding. For ages 14 to 18 they are 890 mcg, rising to the same 1,000 and 1,300 mcg. EFSA sets 1.5 mg a day for both.
Older adults have the same target as other adults: the US allowance does not change for ages 19 and up. Most people reach it. US adults eat about 1,400 mcg (men) and 1,100 mcg (women) a day from food.
In survey data from 2009 to 2012, 6% to 15% of adults who did not take a copper-containing supplement ate less than the average requirement. Among supplement users it was 2.2% to 7.2%.
Copper: recommended intake per day
US: Adequate Intake / Recommended Dietary Allowance (NASEM). EU: Adequate Intake (EFSA).
| Age and sex | US (RDA) | EU (AI) |
|---|---|---|
| Men, 31–50 years | 0.9 mg | 1.6 mg |
| Women, 31–50 years | 0.9 mg | 1.3 mg |
All ages, pregnancy and breastfeeding
| Age and sex | US (AI/RDA) | EU (AI) |
|---|---|---|
| Infants 0–6 months | 0.2 mg | None set |
| Infants 7–11 months | None set | 0.4 mg |
| Infants 7–12 months | 0.22 mg | None set |
| Children 1–2 years | None set | 0.7 mg |
| Children 1–3 years | 0.34 mg | None set |
| Children 3 years | None set | 1 mg |
| Children 4–6 years | None set | 1 mg |
| Children 4–8 years | 0.44 mg | None set |
| Children 7–9 years | None set | 1 mg |
| Females 9–13 years | 0.7 mg | None set |
| Males 9–13 years | 0.7 mg | None set |
| Children 10 years, female | None set | 1.1 mg |
| Children 10 years, male | None set | 1.3 mg |
| Children 11–17 years, female | None set | 1.1 mg |
| Children 11–17 years, male | None set | 1.3 mg |
| Females 14–18 years | 0.89 mg | None set |
| Males 14–18 years | 0.89 mg | None set |
| Adults 18+ years, female | None set | 1.3 mg |
| Adults 18+ years, male | None set | 1.6 mg |
| Females 19–30 years | 0.9 mg | None set |
| Males 19–30 years | 0.9 mg | None set |
| Females 31–50 years | 0.9 mg | None set |
| Males 31–50 years | 0.9 mg | None set |
| Females 51–70 years | 0.9 mg | None set |
| Males 51–70 years | 0.9 mg | None set |
| Females >70 years | 0.9 mg | None set |
| Males >70 years | 0.9 mg | None set |
| Pregnancy 14–18 years | 1 mg | None set |
| Pregnancy | None set | 1.5 mg |
| Pregnancy 19–30 years | 1 mg | None set |
| Pregnancy 31–50 years | 1 mg | None set |
| Lactation 14–18 years | 1.3 mg | None set |
| Lactation | None set | 1.5 mg |
| Lactation 19–30 years | 1.3 mg | None set |
| Lactation 31–50 years | 1.3 mg | None set |
EU and US age bands differ; "None set" means that body sets no value for the group. Label reference: FDA Daily Value 0.9 mg, EU Reference Intake 1 mg.EU and US age bands differ; "None set" means that body sets no value for the group. Label reference: EU Reference Intake 1 mg, FDA Daily Value 0.9 mg.
Copper deficiency: signs and who is at risk
Copper deficiency is uncommon. Based on animal and human studies, the NIH lists many effects. They include anemia, loss of pigment, high cholesterol, connective tissue disorders, osteoporosis, unsteady walking and a higher risk of infection.
In case series the usual picture is a pair of problems. The first is blood changes: anemia, low white blood cell counts and sometimes low platelets. The second is a spinal cord disease with trouble walking. Both can be mistaken for other diseases, such as vitamin B12 deficiency or a bone marrow disorder called myelodysplastic syndrome.
- Stomach, bowel and weight-loss surgery. A Mayo Clinic review covered 40 patients with copper deficiency and blood abnormalities. Of them, 25% had had weight-loss surgery and 35% other stomach or bowel surgery. A meta-analysis put deficiency at 16% to 28% of patients 1 to 4 years after weight-loss surgery. A systematic review of 17 studies of the first 12 months judged most to be of low quality, so the true rate is uncertain.
- High zinc intake. People who regularly take high doses of zinc supplements or use excessive amounts of zinc-containing denture cream can develop copper deficiency, the NIH says. In a Scottish review, 12 of 16 people with copper deficiency had high blood zinc.
- Celiac disease. In a study of 200 adults and children with celiac disease, 15% had copper deficiency. The American College of Gastroenterology notes that copper levels normalize within a month of adequate supplementation on a gluten-free diet, the NIH reports.
- Menkes disease. This rare inherited disorder sharply reduces copper absorption (see how copper works above).
Copper status is not routinely checked, and the NIH says no biomarker assesses it accurately and reliably. Doctors usually measure serum copper (normal range 10 to 25 µmol/L, or 63.5 to 158.9 mcg/dL). They also measure ceruloplasmin (180 to 400 mg/L). Both can be changed by estrogen, pregnancy, infection, inflammation and some cancers, so results are read together with symptoms.
A review adds a 24-hour urine copper test. Copper deficiency anemia is treated with oral or intravenous copper. Blood changes are fully reversible over 4 to 12 weeks, but nerve damage is only partly reversible.
Sources
- Copper: fact sheet for health professionals. National Institutes of Health, Office of Dietary Supplements. Updated October 18, 2022.
- EFSA Panel on Dietetic Products, Nutrition and Allergies (NDA). Scientific opinion on dietary reference values for copper. EFSA J. 2015.
- Dietary reference values for the EU: summary tables. European Food Safety Authority. Version 4, September 2017.
- Halfdanarson TR, Kumar N, Li CY, Phyliky RL, Hogan WJ. Hematological manifestations of copper deficiency: a retrospective review. Eur J Haematol. 2008.
- Xu B, Xiao T, Li J, et al. Copper Deficiency: A Frequently Overlooked Complication After MBS-A Systematic Review and Meta-analysis. Obes Surg. 2025.
- Lewis CA, de Jersey S, Seymour M, Hopkins G, Hickman I, Osland E. Iron, Vitamin B(12), Folate and Copper Deficiency After Bariatric Surgery and the Impact on Anaemia: a Systematic Review. Obes Surg. 2020.
- Gabreyes AA, Abbasi HN, Forbes KP, McQuaker G, Duncan A, Morrison I. Hypocupremia associated cytopenia and myelopathy: a national retrospective review. Eur J Haematol. 2013.
- Myint ZW, Oo TH, Thein KZ, Tun AM, Saeed H. Copper deficiency anemia: review article. Ann Hematol. 2018.
Forms of copper: absorption and effects
Copper supplements come as several compounds. The NIH lists cupric oxide, cupric sulfate, copper amino acid chelates and copper gluconate. It says no studies have compared the bioavailability (how well the body absorbs them) of these and other forms. The Linus Pauling Institute, in a page reviewed in July 2024, says the same.
Products range from a few micrograms to 15 mg of copper, which the NIH calls about 17 times the Daily Value.
The honest bottom line is that we found no trial in people that compared one copper form with another. We found none that tested a form for a health outcome either. The one form with a documented drawback is cupric oxide, which dissolves poorly. EFSA judged its bioavailability to be lower than that of other inorganic copper sources.
A 1999 commentary in the Journal of Nutrition argued that cupric oxide should not be used as a copper supplement for animals or humans. Claims that copper bisglycinate or other chelated forms are absorbed better have no human trial behind them that we found.
The forms used in the main trials on this page were:
- Alzheimer’s disease trial. Copper(II) orotate dihydrate, 8 mg of copper a day for 12 months.
- Heart-marker trials. Copper glycinate (2 mg a day for 8 weeks) and copper sulfate (3 and 6 mg a day for 4 weeks each).
- Drinking-water trials. Copper sulfate added to tap water in the trial of 60 women. The abstract of the 1,365-adult trial does not name the form.
- Deficiency treatment. A review names oral or intravenous copper as gluconate, sulfate or chloride. The case-series abstracts do not name the form.
- AREDS eye trial. 2 mg of copper as cupric oxide, together with 80 mg of zinc as zinc oxide.
| Form | Share of copper by weight | What studies show | Source |
|---|---|---|---|
| Copper in food | Not applicable | The NIH lists shellfish, seeds and nuts, organ meats, wheat-bran cereals, whole grains and chocolate as the richest sources. People absorb 30% to 40% of the copper in typical diets, and the share falls as intake rises (55.6% to 12.4% in one isotope study). In rats, copper from several foods was absorbed as well as copper sulfate. | 1, 5, 6, 7 |
| Cupric oxide | About 80% (2 mg of copper = 2.5 mg of oxide, per EFSA) | Dissolves poorly. EFSA judged its bioavailability lower than other inorganic sources but expects some absorption, and the makers gave no specific data. A 1999 commentary argued against its use. The AREDS eye tablet used 2 mg as cupric oxide. We found no human absorption comparison. | 3, 4, 15 |
| Cupric sulfate | Not stated | Soluble. EFSA cites 25% to 60% absorption for mostly soluble copper salts such as sulfate. At 3 and 6 mg a day for 4 weeks, it raised serum copper and a copper enzyme in 16 women. In drinking water at 3 mg/L or more, it went with nausea or stomach pain. Named as a treatment form for deficiency. | 3, 9, 12, 14 |
| Copper gluconate | Not stated | In 7 adults, 10 mg of copper a day for 12 weeks changed no copper level and caused no more side effects than placebo. Named as a treatment form for deficiency. We found no absorption comparison with other forms. | 8, 14 |
| Copper glycinate and other amino acid chelates | Not stated | Glycinate at 2 mg a day for 8 weeks raised two copper enzymes against placebo in adults with moderately high cholesterol. No human trial compared a chelate with another form. In 2009 EFSA said it could not assess the safety of copper amino acid chelate in food supplements from the dossiers supplied. | 1, 10, 16 |
Three studies bear directly on forms. None compares two supplement forms in people. They are an EFSA opinion on the oxide, a small trial of the gluconate form, and a rat study that compared foods with copper sulfate.
All 3 studies, strongest evidence first
EFSA: copper oxide is absorbed less than other inorganic copper
EFSA’s opinion on copper(II) oxide in food supplements, adopted 14 May 2009, still expected some absorption despite poor solubility. The makers supplied no specific bioavailability data, so EFSA reasoned from solubility: the oxide dissolves in stomach acid. Absorption from mostly soluble salts such as copper sulfate has been put at 25% to 60%, with the oxide expected at the lower end. The opinion converts 2 mg of copper to 2.5 mg of copper(II) oxide, and it rests on reasoning, not a human comparison trial.
10 mg of copper daily changed no copper levels in seven adults
In this double-blind trial, seven adults took copper gluconate or placebo capsules for 12 weeks. Blood, urine and hair copper did not change, nor did zinc, magnesium, hematocrit, triglycerides, cholesterol or blood enzyme tests. Nausea, diarrhea and heartburn were as common on placebo. It was a very small, old study, and 10 mg is the current US upper limit. EFSA’s 2023 opinion notes that this one study was the basis for earlier upper limits.
In rats, copper from foods was absorbed as well as copper sulfate
Rats ate test meals labeled with a copper isotope. Absorption was 46% from sunflower seeds, 41% from peanuts, 50% from cooked shrimp and 40% from cooked beef, against 46% from copper sulfate. Copper from plant foods (39%) and animal foods (43%) was absorbed equally well. Glucose, fructose, sucrose or cornstarch in the meal did not change absorption, and this is an animal study, not a test in people.
Sources
- Copper: fact sheet for health professionals. National Institutes of Health, Office of Dietary Supplements. Updated October 18, 2022.
- Collins JF. Copper. Linus Pauling Institute, Micronutrient Information Center, Oregon State University. Reviewed and updated July 2024.
- EFSA Panel on Food Additives and Nutrient Sources added to Food (ANS). Copper(II) oxide as a source of copper added for nutritional purposes to food supplements. EFSA J. 2009.
- Baker DH. Cupric oxide should not be used as a copper supplement for either animals or humans. J Nutr. 1999.
- Wapnir RA. Copper absorption and bioavailability. Am J Clin Nutr. 1998.
- Turnlund JR, Keyes WR, Anderson HL, Acord LL. Copper absorption and retention in young men at three levels of dietary copper by use of the stable isotope 65Cu. Am J Clin Nutr. 1989.
- Johnson PE, Stuart MA, Bowman TD. Bioavailability of copper to rats from various foodstuffs and in the presence of different carbohydrates. Proc Soc Exp Biol Med. 1988.
- Pratt WB, Omdahl JL, Sorenson JR. Lack of effects of copper gluconate supplementation. Am J Clin Nutr. 1985.
- Bügel S, Harper A, Rock E, O’Connor JM, Bonham MP, Strain JJ. Effect of copper supplementation on indices of copper status and certain CVD risk markers in young healthy women. Br J Nutr. 2005.
- DiSilvestro RA, Joseph EL, Zhang W, Raimo AE, Kim YM. A randomized trial of copper supplementation effects on blood copper enzyme activities and parameters related to cardiovascular health. Metabolism. 2012.
- Kessler H, Bayer TA, Bach D, et al. Intake of copper has no effect on cognition in patients with mild Alzheimer’s disease: a pilot phase 2 clinical trial. J Neural Transm (Vienna). 2008.
- Pizarro F, Olivares M, Uauy R, Contreras P, Rebelo A, Gidi V. Acute gastrointestinal effects of graded levels of copper in drinking water. Environ Health Perspect. 1999.
- Araya M, Olivares M, Pizarro F, González M, Speisky H, Uauy R. Gastrointestinal symptoms and blood indicators of copper load in apparently healthy adults undergoing controlled copper exposure. Am J Clin Nutr. 2003.
- Myint ZW, Oo TH, Thein KZ, Tun AM, Saeed H. Copper deficiency anemia: review article. Ann Hematol. 2018.
- Age-Related Eye Disease Study Research Group. A randomized, placebo-controlled, clinical trial of high-dose supplementation with vitamins C and E, beta carotene, and zinc for age-related macular degeneration and vision loss: AREDS report no. 8. Arch Ophthalmol. 2001.
- EFSA Panel on Food Additives and Nutrient Sources added to Food (ANS). Inability to assess the safety of calcium amino acid chelate, copper amino acid chelate, magnesium amino acid chelate, manganese amino acid chelate and zinc amino acid chelate added for nutritional purposes to food supplements based on the supporting dossiers. EFSA J. 2009.
- More SJ, Bampidis V, Benford D, et al. Re-evaluation of the existing health-based guidance values for copper and exposure assessment from all sources. EFSA J. 2023.
Is copper safe? Supplements, dose and interactions
Copper from food is not a concern for most people. The NIH says copper toxicity is rare in healthy people who do not have an inherited copper-handling defect. Cases have followed water that stood in copper pipes.
For adults, the US tolerable upper intake level (UL) is 10,000 mcg (10 mg) a day from food and supplements. The UL is the most a day unlikely to cause harm, and it was set to prevent liver damage.
It is 8 mg for ages 14 to 18, including pregnancy and breastfeeding at those ages. For younger children it is 5 mg at 9 to 13, 3 mg at 4 to 8 and 1 mg at 1 to 3. In pregnancy and breastfeeding at 19 and older it is 10 mg.
No limit is set for infants, who should get copper only from breast milk, formula and food. The limits do not apply to people given copper as treatment under a doctor’s care.
In the EU, the Scientific Committee on Food set an upper level of 5 mg a day for adults in 2003. EFSA adopted it in 2006, and EFSA’s August 2025 overview of upper levels still lists it.
EFSA’s Scientific Committee gave a new opinion in 2023, adopted in November 2022. It said the 10 mg a day used in earlier risk assessments can no longer be considered a no-effect level. It concluded that no copper build-up in the body is expected at 5 mg a day. It set an acceptable daily intake of 0.07 mg per kg of body weight, equal to 5 mg a day for adults.
That figure is an acceptable daily intake, not a formal upper level. The opinion says upper levels for each age group are to be set separately.
- Doses and side effects. Chronic high intake can cause liver damage and stomach and bowel symptoms such as abdominal pain, cramps, nausea, diarrhea and vomiting. In a 12-week double-blind trial, 7 adults on 10 mg a day as gluconate showed no change in copper levels. They had no more side effects than placebo. In 9 men who added 7 mg a day to their diet for 129 days, some copper and immune measures changed. They included a lower antibody response to an influenza vaccine, and the authors say the meaning is unknown.
- Drinking water. The WHO guideline value is 2 mg/L. It protects against acute stomach effects, with a margin of safety, in people with normal copper handling. Copper stains laundry above 1 mg/L, and the taste turns bitter above 2.5 mg/L. Standing or partly flushed water in copper plumbing is often above 1 mg/L, while running or fully flushed water tends to be low. Infants fed formula mixed with tap water are most exposed. The US EPA action level is 1.3 mg/L (1.3 ppm). If more than 10% of sampled taps exceed it, the water system must take steps to control corrosion. In trials, nausea or stomach pain rose at 3 mg/L or more in 60 women and at 6 mg/L in 1,365 adults.
- Inherited disorders. People with Wilson disease, biliary atresia or biliary cirrhosis should avoid supplemental copper, the Linus Pauling Institute advises. It says copper for infants should be approached with caution. Wilson disease needs lifelong specialist treatment.
- Zinc. Long-term high doses of zinc can cause copper deficiency, as described above. The AREDS eye tablet paired 80 mg of zinc with 2 mg of copper as cupric oxide.
- Alzheimer’s disease. The NIH reports that experts at a 2013 conference suggested people at higher risk of Alzheimer’s disease choose multivitamins without copper or iron. It adds that much more research is needed. Our study cards above show no benefit or harm from 8 mg a day in one small trial.
- Medicines. The NIH says copper is not known to have clinically relevant interactions with medications.
How to get more copper
- Best food. Oysters give 1.34 mg in 3 oz, 149% of the Daily Value, and the NIH lists pan-fried beef liver at 12.4 mg in 3 oz. Cashews give 0.62 mg per ounce and sunflower seeds 0.51 mg.
- Let absorption do its work. The body absorbed 55.6% of copper on a low-copper diet and 12.4% on a high one. Phytate and fiber did not change absorption in one trial. Zinc supplements of 50 mg a day for 6 weeks lowered a copper enzyme in healthy men.
- Food first, supplements for a reason. Most US adults reach the allowance from food. Supplements are mainly for deficiency found by a doctor, and total intake should stay under 10 mg a day (5 mg in the EU). After weight-loss surgery or long-term zinc use, ask your doctor whether to check copper.
Sources
- Copper: fact sheet for health professionals. National Institutes of Health, Office of Dietary Supplements. Updated October 18, 2022.
- Overview on tolerable upper intake levels as derived by the Scientific Committee on Food (SCF) and the EFSA Panel on Dietetic Products, Nutrition and Allergies (NDA). European Food Safety Authority. Version 11, August 2025.
- More SJ, Bampidis V, Benford D, et al. Re-evaluation of the existing health-based guidance values for copper and exposure assessment from all sources. EFSA J. 2023.
- Chemical fact sheets: copper. In: Guidelines for drinking-water quality, fourth edition incorporating the first and second addenda. World Health Organization. 2022.
- Lead and Copper Rule. US Environmental Protection Agency.
- Collins JF. Copper. Linus Pauling Institute, Micronutrient Information Center, Oregon State University. Reviewed and updated July 2024.
- Pratt WB, Omdahl JL, Sorenson JR. Lack of effects of copper gluconate supplementation. Am J Clin Nutr. 1985.
- Turnlund JR, Jacob RA, Keen CL, et al. Long-term high copper intake: effects on indexes of copper status, antioxidant status, and immune function in young men. Am J Clin Nutr. 2004.
- Pizarro F, Olivares M, Uauy R, Contreras P, Rebelo A, Gidi V. Acute gastrointestinal effects of graded levels of copper in drinking water. Environ Health Perspect. 1999.
- Araya M, Olivares M, Pizarro F, González M, Speisky H, Uauy R. Gastrointestinal symptoms and blood indicators of copper load in apparently healthy adults undergoing controlled copper exposure. Am J Clin Nutr. 2003.
- Turnlund JR, Keyes WR, Anderson HL, Acord LL. Copper absorption and retention in young men at three levels of dietary copper by use of the stable isotope 65Cu. Am J Clin Nutr. 1989.
- Turnlund JR, King JC, Gong B, Keyes WR, Michel MC. A stable isotope study of copper absorption in young men: effect of phytate and alpha-cellulose. Am J Clin Nutr. 1985.
- Fischer PW, Giroux A, L’Abbé MR. Effect of zinc supplementation on copper status in adult man. Am J Clin Nutr. 1984.
- Age-Related Eye Disease Study Research Group. A randomized, placebo-controlled, clinical trial of high-dose supplementation with vitamins C and E, beta carotene, and zinc for age-related macular degeneration and vision loss: AREDS report no. 8. Arch Ophthalmol. 2001.
- Johnson PE, Stuart MA, Bowman TD. Bioavailability of copper to rats from various foodstuffs and in the presence of different carbohydrates. Proc Soc Exp Biol Med. 1988.
History of copper
Two inherited copper diseases were described long before the nutrient role of copper was clear. In 1912 Kinnier Wilson published a long paper in the journal Brain on progressive lenticular degeneration. It described a familial nervous disease associated with cirrhosis of the liver. The disease now carries his name and is known to be caused by mutations in the gene ATP7B.
In 1962 Menkes and colleagues described a sex-linked recessive disorder with retardation of growth, peculiar hair, and focal cerebral and cerebellar degeneration. It is now called Menkes disease and is caused by ATP7A mutations.
The nutritional story starts in 1928. That year Hart, Steenbock, Waddell and Elvehjem published a paper titled “Copper as a supplement to iron for hemoglobin building in the rat” in the Journal of Biological Chemistry. Nutrition Reviews later listed it among its nutrition classics.
The modern reference values are recent. In 2008 a study reported that newborns with Menkes disease treated with copper in the first weeks had far better survival than late-treated patients. EFSA set European adequate intakes for copper in 2015, and in 2023 its Scientific Committee re-evaluated the existing guidance values for copper.
Sources
- Compston A. Progressive lenticular degeneration: a familial nervous disease associated with cirrhosis of the liver, by S. A. Kinnier Wilson, (From the National Hospital, and the Laboratory of the National Hospital, Queen Square, London) Brain 1912: 34; 295-509. Brain. 2009.
- Hart EB, Steenbock H, Waddell J, Elvehjem CA. Iron in nutrition. VII. Copper as a supplement to iron for hemoglobin building in the rat. 1928. J Biol Chem. 2002.
- . Nutrition classics. The Journal of Biological Chemistry, Vol. LXXVII, 1928: Iron in nutrition. VII. Copper as a supplement to iron for hemoglobin building in the rat. By E.B. Hart, H. Steenbock, J. Waddell, and C.A. Elvehjem. Nutr Rev. 1987.
- MENKES JH, ALTER M, STEIGLEDER GK, WEAKLEY DR, SUNG JH. A sex-linked recessive disorder with retardation of growth, peculiar hair, and focal cerebral and cerebellar degeneration. Pediatrics. 1962.
- Członkowska A, Litwin T, Dusek P, et al. Wilson disease. Nat Rev Dis Primers. 2018.
- Kaler SG, Holmes CS, Goldstein DS, et al. Neonatal diagnosis and treatment of Menkes disease. N Engl J Med. 2008.
- Copper: fact sheet for health professionals. National Institutes of Health, Office of Dietary Supplements. Updated October 18, 2022.
- EFSA Panel on Dietetic Products, Nutrition and Allergies (NDA). Scientific opinion on dietary reference values for copper. EFSA J. 2015.
- More SJ, Bampidis V, Benford D, et al. Re-evaluation of the existing health-based guidance values for copper and exposure assessment from all sources. EFSA J. 2023.
Frequently asked questions about copper
How much copper per day for a woman?
Adult women need 900 mcg (0.9 mg) of copper a day in the US, the same as men. The allowance rises to 1,000 mcg in pregnancy and 1,300 mcg while breastfeeding (ages 19 and older). EFSA gives 1.3 mg for adult women and 1.5 mg in pregnancy and while breastfeeding. The US upper limit is 10 mg a day from food and supplements.
Can too much zinc cause copper deficiency?
Yes: the NIH says high zinc intakes can interfere with copper absorption. A copper enzyme fell in healthy men taking 50 mg of zinc a day for 6 weeks. Case series describe anemia, low white blood cells and nerve damage. In a Scottish review, 12 of 16 people with copper deficiency had high blood zinc and 9 used zinc-containing dental fixatives. The US upper limit for zinc, 40 mg a day, was set partly for this reason.
Which foods are highest in copper?
The NIH lists pan-fried beef liver first, at 12.4 mg in 3 oz, ahead of cooked wild oysters (4.85 mg in 3 oz). In our USDA ranking, oysters lead per serving (1.34 mg in 3 oz), followed by soybeans, adzuki beans and cashews. Sesame seeds (4.08 mg) and cocoa powder (3.79 mg) lead per 100 g. Nuts, seeds, chocolate, mushrooms and potatoes add up over a day.
Is copper in drinking water a concern?
Usually not, but water that has stood in copper pipes can carry enough to upset the stomach. The WHO guideline value is 2 mg/L and the US EPA action level is 1.3 mg/L. In a trial of 60 women, 17% and 15% reported nausea, abdominal pain or vomiting at 3 and 5 mg/L. With no added copper it was 5%, and the WHO notes that running or fully flushed water tends to contain less.
Do copper supplements help heart health or Alzheimer’s disease?
No trial shows that they do. Small trials in healthy adults raised copper enzymes without changing cholesterol, and a meta-analysis of five trials found no effect on blood lipids. In 68 people with mild Alzheimer’s disease, 8 mg a day for a year did not change thinking scores. Observational studies disagree. Higher blood copper went with more coronary heart disease and with Alzheimer’s disease, while a US cohort linked higher dietary copper to lower death rates.
What is the best form of copper supplement?
No form has been shown to be better. The NIH and the Linus Pauling Institute say no human study has compared the bioavailability of cupric oxide, sulfate, gluconate and amino acid chelates. The one form with a documented drawback is cupric oxide, which dissolves poorly, according to EFSA. Supplements are mainly for deficiency found by a doctor.
Can copper deficiency be mistaken for vitamin B12 deficiency?
Yes. In 13 adults, copper deficiency caused a spinal cord disease that resembled the disease seen in vitamin B12 deficiency. Its blood changes can look like a bone marrow disorder, and a very low ceruloplasmin was the first clue. In a Scottish review, 93% of blood count problems responded to copper, but only 25% of patients improved in nerve function. So early diagnosis matters.
What are Menkes disease and Wilson disease?
Both are rare inherited disorders of copper handling. In Menkes disease (ATP7A), absorption is sharply reduced and the body runs short. Early copper injections raised survival to 92%, against 13% in late-treated patients. In Wilson disease (ATP7B), copper builds up in the liver and brain, and treatment is chelation or zinc. Neither is caused by diet, and people with Wilson disease should avoid supplemental copper.