
Sodium is the main positively charged particle (ion) in the fluid outside your cells. EFSA, the EU’s food safety agency, lists its jobs. With potassium, it makes the electric charge that nerves and muscles use. It also helps set how much water your body holds, and it pulls sugars and amino acids into cells.
A 70-kg man holds roughly 85 to 96 g of sodium, and about 95% of it is outside cells.
Here is the part most people do not know: sodium is not the same as salt. And it is a nutrient most people eat too much of, not too little. Table salt is about 40% sodium and 60% chloride, says the American Heart Association, so 5 g of salt holds 2,000 mg of sodium.
WHO (the World Health Organization) put the global average in 2021 at 4,278 mg of sodium a day, more than double its advice. The FDA (the US Food and Drug Administration) puts the US average at about 3,400 mg.
Most of that sodium does not come from the salt shaker. More than 70% of the sodium Americans eat comes from packaged, prepared and restaurant food, the FDA says. Real deficiency from diet is rare, because the kidneys hold on to sodium when intake is low.
So this page is mostly about how much is enough and how much is too much. It also covers what the evidence says about cutting back, including the argument over whether eating very little could do harm.
Health benefits of sodium
The top findings from 30 studies, strongest evidence first
What the stars mean
- Strong. Several randomized trials, pooled in a meta-analysis, point the same way, or regulators (FDA or EFSA) have approved the claim.
- Moderate. Good randomized trials support it, but there are fewer of them, or their results vary.
- Limited. Small, short or single trials, or mixed results. Promising, but it needs confirmation.
Population and lab studies get no stars: they show a link or a mechanism, not proof.
How we rate evidence →- ★★★Lower blood pressureAcross 133 trials in adults, eating less sodium lowered the top number (by 4.26 mm Hg systolic). A separate review of 34 trials found a bigger drop with high blood pressure (5.39 mm Hg) than with normal pressure (2.42 mm Hg).
- ★★★Fewer IV fluids with a weaker rehydration drinkIn hospital children with acute diarrhea, a drink with less sodium and glucose made unplanned IV fluids less likely (0.59 times the odds). Both drinks contain sodium, so sodium alone was not tested.
- ★★Salt substitutes: lower blood pressure, fewer strokesA Cochrane review of 26 trials found salt substitutes probably lowered the top number (by 4.76 mm Hg systolic). In rural China, a substitute with 25% potassium chloride meant strokes were 0.86 times as frequent in people at risk.
- ★★Unclear effect on deaths and heart diseaseIn adults with prehypertension, sodium counseling went with 0.75 times the cardiovascular events 10 to 15 years later. A Cochrane review of eight trials found no clear drop in deaths.
- ★★Low sodium: no clear gain in heart failureIn 806 people with heart failure, advice to eat under 1500 mg of sodium a day brought intake down only to 1658 mg. That did not clearly cut hospital visits, emergency visits or deaths (15% against 17%), and a review of 17 trials agreed.
All 26 studies, strongest evidence first
Eating less sodium cut systolic blood pressure by 4.26 mm Hg
This meta-analysis (a study that pools earlier studies) covered 133 randomized trials in 12,197 adults. In a randomized trial, chance decides who gets which diet. All trials measured sodium in 24-hour urine, and the average cut was 130 mmol (millimoles) a day. Each 50 mmol cut went with a 1.10 mm Hg lower systolic (top number) pressure. The fall was larger in older people, non-white groups and people with higher starting pressure. Several authors belong to non-profit salt-reduction campaign groups, and one received salt substitute from companies for trials.
A modest salt cut lowered blood pressure by 4.18/2.06 mm Hg
This meta-analysis pooled 34 trials in 3,230 adults that lasted at least four weeks and cut salt by 4.4 g a day. Systolic pressure fell 5.39 mm Hg in people with high blood pressure (hypertension) and 2.42 mm Hg in people with normal pressure. The hormones renin, aldosterone and noradrenaline rose slightly, and blood fats (lipids) did not clearly change. The same trials were also published as a Cochrane review (Cochrane is a group known for careful reviews of trials).
Sodium and blood pressure were linked in a near-straight line
This dose-response analysis pooled 85 trials and found no flattening at the lowest intakes. Trials lasted 4 weeks to 36 months, and sodium intake ranged from 0.4 to 7.6 g a day. The pattern was similar with and without hypertension, but pressure fell more steeply after a sodium cut when it started higher. Study length, design, blood pressure medicine and sex made little difference.
National Academies rated the blood pressure evidence high, heart events moderate
In 2019 a committee of NASEM, the US National Academies, drew on a systematic review of trials and cohort studies. It rated as high the evidence that cutting sodium lowers blood pressure, and as moderate the evidence for fewer cardiovascular events. It also rated as moderate the evidence on hypertension and on deaths from any cause. For cardiovascular death, heart attack, stroke, kidney disease and osteoporosis the evidence was low or insufficient, because few trials measured them. It judged that J-shaped patterns in some cohort studies (more risk at both ends) were probably due to how sodium was measured.
EFSA’s review of 32 trials: lower sodium meant lower blood pressure
The 2019 EFSA opinion kept only randomized trials and prospective studies (which follow people forward) that used at least one 24-hour urine collection. Lower sodium meant 3.9 mm Hg lower systolic and 2.0 mm Hg lower diastolic (bottom number) pressure. Each 100 mmol (2.3 g) rise in 24-hour urine sodium went with a 5.3 mm Hg higher systolic pressure. For cardiovascular disease, EFSA could draw only limited conclusions. There was some evidence of a positive link with coronary heart disease and, in a few studies, an inverse link with stroke.
In white adults, low sodium cut systolic 5.71 mm Hg with hypertension
This Cochrane review compared low-sodium and high-sodium diets in randomized trials, where white participants cut sodium from 203 to 65 mmol a day. With normal pressure, systolic fell only 1.14 mm Hg and diastolic did not change. Effects looked a little larger in Black and Asian participants, on weaker evidence. Renin, aldosterone and noradrenaline rose, as did cholesterol (5.19 mg/dL) and triglycerides (7.10 mg/dL). The review began from cohort studies linking salt below 6 g a day to higher mortality. The authors of the He review above argue that such analyses include many very short trials with large changes in intake.
A weaker rehydration drink cut the need for IV fluids in children
Oral rehydration solutions pair sodium with glucose to treat diarrhea. This Cochrane review covered randomized trials in children in hospital with acute diarrhea. It compared a weaker (reduced-osmolarity) solution, with less sodium and glucose, against the WHO standard one. In the 8 trials pooled, unplanned intravenous (IV) fluids were less likely (0.59 times the odds). Stool output was also lower (11 trials) and vomiting less frequent (6 trials), with no added risk of low blood sodium. Both solutions contain sodium, so the review does not test sodium alone.
Low-sodium DASH diet cut pressure 11.5 mm Hg in hypertension
In the DASH-Sodium trial, 412 people ate a typical US diet or the DASH diet, which is rich in vegetables, fruit and low-fat dairy. They ate their diet at high, intermediate and low sodium for 30 days each, in random order. Going from high to intermediate sodium cut systolic pressure by 2.1 mm Hg on the US diet and 1.3 on DASH. Going on to low cut it by a further 4.6 and 1.7. The 11.5 compares low-sodium DASH with the high-sodium US diet, two changes at once, so sodium alone cannot take the credit.
A low-sodium week lowered blood pressure in 73.4% of people
In this crossover trial, 213 adults aged 50 to 75 ate their usual diet for a week. Then they had a high-sodium week and a low-sodium week. The high-sodium week added about 2200 mg of sodium a day to usual food, and the low-sodium week held about 500 mg in total. Mean arterial pressure (the average across a heartbeat) fell on the low week. Median systolic pressure was 126 mm Hg on the high-sodium diet and 119 on the low one, with or without blood pressure medicine. Adverse events were mild, in 9.9% and 8.0% of people.
A salt substitute meant fewer strokes and deaths in rural China
The Salt Substitute and Stroke Study (SSaSS) was an open-label trial (people knew which salt they had) in 600 villages. It followed 20,995 people who had a past stroke, or were 60 or older with high blood pressure, for 4.74 years. Against regular salt, strokes were 0.86 times as frequent, deaths 0.88 times and major cardiovascular events 0.87 times. The substitute was 75% sodium chloride and 25% potassium chloride, so it cut sodium and raised potassium, and sodium alone cannot take the credit. Serious adverse events put down to high blood potassium (hyperkalemia) were not clearly higher: 3.35 against 3.30 per 1000 person-years.
Low-sodium salt substitutes probably lower systolic pressure by 4.76 mm Hg
This Cochrane review pooled 26 trials in adults. The substitutes also slightly cut cardiovascular deaths. With moderate-certainty evidence, diastolic pressure fell 2.43 mm Hg and blood potassium rose 0.12 mmol/L. Hyperkalemia was little different from regular salt in 5 trials. But all trials excluded people in whom extra potassium is harmful, none studied pregnant women, and the evidence in children was very uncertain.
Assigned sodium cuts: 25% fewer cardiovascular events 10 to 15 years later
This long-term follow-up covered two trials (TOHP I and II) in adults aged 30 to 54 with prehypertension, blood pressure just above normal. They randomly assigned 744 and 2,382 people to sodium counseling, for 18 months and 36 to 48 months. Net sodium cuts were 44 and 33 mmol a day. Follow-up information came from 77% of people, with 200 cardiovascular events (0.75 times the risk). Deaths did not clearly differ (0.80).
Eight trials: salt advice did not clearly cut deaths or cardiovascular disease
This Cochrane review had 6 to 36 months of follow-up, and its trials were too small to tell for sure. Eight trials included 3,518 people with normal blood pressure and 3,766 with hypertension or a mix. Death rates showed no drop (0.99 times the risk in people with hypertension at longest follow-up). A weak signal for fewer cardiovascular events (0.77, pooling six trials) was driven by one trial in retirement homes. There the kitchens cut the salt, so residents did not have to change their own habits.
In heart failure, low sodium did not cut hospital visits or deaths
This open-label trial followed 806 people with heart failure for 12 months. It compared a diet under 1500 mg of sodium a day with usual care. The low-sodium group cut median intake from 2286 to 1658 mg a day, still above the target. Hospital admissions, emergency visits or deaths hit 15% against 17% (0.89 times the risk), a gap that could be chance. No safety events related to the diet were reported.
Sodium limits in heart failure did not cut deaths or hospital stays
This meta-analysis pooled 17 trials, with 834 patients in the restriction groups and 871 in the control groups. Deaths from any cause were 0.95 times the odds and hospital stays 0.84 times, and neither gap was clear. Two trials, holding two-thirds of the data, showed a better New York Heart Association class (a symptom score). And 6 of 10 trials showed better quality of life, so limiting sodium may help how people feel.
Salt tablets during an Ironman did not change blood sodium
This randomized trial took place at the 2001 Cape Town Ironman, about 12 hours of racing, with 413 triathletes. Tablets added 3.6 g of sodium during the race. Each held 620 mg of table salt, the placebo (dummy pill) held 596 mg of starch, and other athletes took nothing. Blood sodium before and after the race, weight change and finishing time did not clearly differ. The authors conclude that the US adequate intake of 1.5 g a day seems enough for a healthy person, without extra sodium during sport.
Less salt, normal calcium: fewer kidney stone relapses in men
This randomized trial followed 120 men with recurrent calcium oxalate stones and high urine calcium for five years. On a diet with normal calcium, less animal protein and less salt, 12 of 60 men relapsed. On a low-calcium diet, 23 of 60 did (0.49 times the risk). The diet mixed three changes, so salt alone cannot take the credit. Urine oxalate fell on the mixed diet and rose on the low-calcium diet.
In kidney disease, a low-sodium diet cut urine protein by 51%
In this crossover trial, 52 people with kidney disease, already taking an ACE inhibitor drug, went through four 6-week periods. They had a low-sodium diet (target 50 mmol a day) or a regular one (200 mmol), with a second drug, valsartan, or placebo. Valsartan cut urine protein by 21%, less than the diet did. Urine sodium reached 106 and 184 mmol a day, and systolic pressure fell from 134 to 123 mm Hg on the low-sodium diet. The diet was open label, and one author reported support from Novartis for the work.
Each extra 1000 mg of sodium went with 18% higher cardiovascular risk
This analysis pooled six cohorts, each with at least two 24-hour urine samples per person. It followed 10,709 generally healthy adults for a median 8.8 years, with 571 events. The highest quarter of sodium in urine had 1.60 times the risk of the lowest, and the authors describe a dose-response pattern. Each 1000 mg a day of potassium in urine went with an 18% lower risk.
PURE: high and low sodium went with more deaths and heart events
The PURE cohort followed 101,945 people in 17 countries for a mean 3.7 years. It estimated intake from one morning fasting urine sample, not from 24-hour collections. Death and cardiovascular events were compared with 4 to 6 g a day (4.00 to 5.99 g). Against that, 7.00 g or more had 1.15 times the odds and under 3.00 g had 1.27 times. The NASEM committee rated this study as high risk of bias.
Sodium went with cardiovascular events only where average intake topped 5 g
This PURE analysis followed 82,544 people in 255 communities for a median 8.1 years, again using a morning urine sample. In the lowest third of communities, more sodium went with fewer cardiovascular events. There was no link in the middle third, and in the highest third a positive link that could be chance. Stroke was positively linked to sodium in China (mean intake 5.58 g a day) but inversely in other countries (4.49 g). The authors suggest that sodium reduction might suit communities with high intake and not others. The NASEM committee also rated this study as high risk of bias.
Accurately measured sodium showed a straight-line link with deaths
This reanalysis of TOHP data covered 2,974 adults with prehypertension who were not assigned to a sodium intervention. They were followed a median 24 years, with 272 deaths. Averaged from three to seven 24-hour urines, sodium was 3769 mg a day. The Kawasaki formula overestimated it by 1297 mg a day, reading too high at low intakes and too low at high ones. Formula-based estimates drew a J-shaped curve, and the authors say this could explain much of the J-shaped findings in some cohorts.
Of three formulas, Kawasaki best estimated 24-hour sodium from morning urine
This study compared formulas in 1,083 people in 11 countries, each formula using one morning urine sample. Agreement with 24-hour urine was 0.71 for Kawasaki, against 0.49 for INTERSALT and 0.54 for Tanaka. Kawasaki read +313 mg a day too high, while the others read 872 and 548 mg too low. The authors, who lead PURE, conclude it suits population studies. Critics point to the TOHP reanalysis above, which found it biased at the low and high ends.
Sodium cohort studies had 3 to 4 flaws per study
This American Heart Association (AHA) review of 26 cohort studies found flaws that could explain why their results disagree. Of 31 analyses, 13 found direct links between sodium and cardiovascular disease, 8 inverse, 2 J-shaped and 8 only null results. All but one study had problems that can flip a result, such as errors in measuring sodium (22 studies) and reverse causality (16). In reverse causality, illness changes the diet rather than the other way round. The advisory says guidelines should keep resting on the blood pressure evidence and the few trials of cutting sodium.
High salt went with 1.68 times the risk of stomach cancer
This meta-analysis pooled seven prospective studies, with 10 cohorts, 268,718 people and 1474 cancers, followed for 6 to 15 years. Both figures compare with low intake, and moderately high intake had 1.41 times the risk. The link was stronger in Japan, and eating more salt-rich foods also went with higher risk. Cohort data cannot prove cause.
13% of 488 marathon finishers had low blood sodium, 0.6% critically
Of 766 runners enrolled before the 2002 Boston Marathon, 488 gave a usable blood sample at the finish line. Low blood sodium (hyponatremia) meant a serum sodium of 135 mmol/L or less, and critical meant 120 or less. It was linked to weight gain during the race (4.2 times the odds) and to extremes of body mass index. A finish time over 4 hours was also linked (7.4 times the odds, against under 3:30). Female sex, the kind of fluid and anti-inflammatory drug use were not linked in the final analysis.
Foods high in sodium
Most whole foods are low in sodium. In our USDA-based ranking, only one food gives more than 20% of the Daily Value (the FDA’s label target, 2,300 mg) in a serving. That food is shrimp, with 805 mg in 3 oz (85 g), or 35%. Scallops follow with 333 mg (14%), then sardines (282 mg in a 92-g can) and olives (162 mg in five large olives).
Per 100 g, shrimp has 947 mg (41% of the Daily Value), then olives 735 mg, scallops 392 mg and sardines 307 mg. Per 100 kcal, shrimp (796 mg) and olives (634 mg) lead. The ranking below has the full list.
The ranking lists the foods in our database, which are mostly unprocessed. So it shows the sodium that is naturally in food, not where most sodium comes from. In a study of 450 US adults, 70.9% of sodium was added to food outside the home and 14.2% was in the food itself. Another 5.6% was added in home cooking and 4.9% at the table.
An older study of 62 regular salt users found 77% added in processing and 11.6% naturally in food. The NASEM report’s survey table puts yeast bread first (6.2% of intake), then pizza (5.9%), sandwiches (5.7%) and cold cuts and cured meats (5.4%).
Per serving. Bars show the share of the Daily Value (2,300 mg a day).
Per 100 g. Bars show the share of the Daily Value (2,300 mg a day).
Per serving. Bars show the share of the EU Reference Intake (2,400 mg a day).
Per 100 g. Bars show the share of the EU Reference Intake (2,400 mg a day).
Per 100 kcal: the same calories of each food, for a fair comparison. Bars compare each food with the top food.
- 1.

- 2.

- 3.
- 4.

- 5.

- 6.

- 7.

- 8.
- 9.

- 10.


- 1.
- 2.
- 3.
- 4.
- 5.

- 6.
- 7.
- 8.
- 9.
- 10.

- 1.
- 2.
- 3.

- 4.
- 5.
- 6.
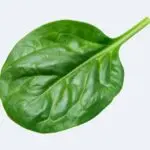
- 7.

- 8.
- 9.
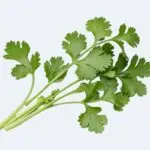
- 10.
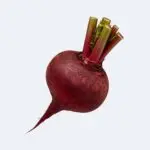


Sources
- FoodData Central. US Department of Agriculture, Agricultural Research Service. Values as shown in the ranking above.
- Harnack LJ, Cogswell ME, Shikany JM, et al. Sources of Sodium in US Adults From 3 Geographic Regions. Circulation. 2017.
- Mattes RD, Donnelly D. Relative contributions of dietary sodium sources. J Am Coll Nutr. 1991.
- National Academies of Sciences, Engineering, and Medicine. Dietary Reference Intakes for Sodium and Potassium. National Academies Press. 2019.
- Sodium in your diet. US Food and Drug Administration.
How sodium works
Most of the biochemistry below comes from EFSA’s 2019 review and from physiology studies, not from trials of extra sodium in people. Four ideas cover it: sodium sits outside cells and moves water, the gut absorbs almost all of it, and the kidneys decide how much stays. Last, less sodium lowers blood pressure, and the body pushes back. After that comes what has been seen in people.
It moves water and carries signals
EFSA describes three jobs for sodium. It helps control the volume and spread of body water, and it lets cells take up dissolved substances (solutes). With potassium, it also makes the electrical charge across cell membranes.
A pump in the cell membrane (the Na+/K+ pump) pushes three sodium ions out for every two potassium ions it brings in. EFSA says this transport uses around 25% of the energy a person burns at rest.
Three main jobs of sodium. Not to scale.
It sits outside cells, and potassium sits inside
Fluid outside cells holds 135 to 145 mmol of sodium per liter and only 3.5 to 5.5 mmol of potassium, says EFSA. Inside cells the figures are about 15 and about 150. About 95% of the body’s sodium is outside cells, but a large share of that sits in bone, skin and muscle. Researchers have proposed that this pool works as a reserve.
In long balance studies, EFSA notes, body sodium also rose and fell in weekly and monthly cycles that did not follow intake. That makes short balance studies hard to read.
Typical sodium and potassium concentrations in mmol per liter, drawn to scale at the middle of the published ranges (outside cells: sodium 135 to 145, potassium 3.5 to 5.5).
The gut absorbs almost all of it
In healthy people almost all dietary sodium is absorbed, even at very high intakes. EFSA reports that about 98.5% was absorbed in a series of balance studies in young adults eating 3.4 g of sodium a day. In men eating a very large amount, it was about 96%. In the small intestine, sodium enters cells through carriers (co-transporters) that bring sugars and other small molecules in with it, and water follows.
The kidneys decide how much stays
Sodium balance is controlled mainly by the kidneys. They filter a lot of sodium and take back more than 99% of it. EFSA says they excrete more when intake is high and save sodium when it is low.
When blood pressure or sodium in the kidney tubule falls, the kidney releases renin. That starts a chain that ends in aldosterone, the hormone that makes the last part of the tubule take back more sodium and lose potassium.
Sweat is the other route that varies. Its sodium ranges from 10 to 180 mmol per liter. That depends on factors such as sodium intake, sweat rate and how used to heat a person is.
How the kidneys take back sodium, as EFSA describes it. Not to scale.
Less sodium lowers blood pressure, and the body pushes back
In a study EFSA describes, eating 12.7 g of sodium a day instead of 1.2 g raised blood plasma volume by about 300 mL. Body weight did not change, which suggests water moved from the fluid between cells into the blood. The simple picture of “more salt, more water in the blood” is probably incomplete, though. EFSA notes that sodium can also be stored in skin, muscle and bone.
In trials, cutting sodium lowers blood pressure, and the body responds with a small rise in renin and aldosterone. Aldosterone rose 73.20 pmol/L in the He meta-analysis. Larger hormone rises and small rises in cholesterol and triglycerides appeared in the Cochrane review by Graudal and colleagues. The He review found no clear change in blood fats, so that point is still argued.
Average fall in systolic blood pressure after a salt cut of 4.4 g a day for four weeks or more, from a meta-analysis of 34 trials, drawn to scale.
What has been seen in people
The clearest human finding is the blood pressure drop. Meta-analyses of randomized trials put it at about 4 mm Hg for the systolic number on average. Falls are bigger in people with hypertension, older adults and people with higher starting pressure.
For heart attacks, strokes and deaths the picture is thinner. A long follow-up of two trials in adults with prehypertension found fewer cardiovascular events. A large trial of a potassium-enriched salt substitute found fewer strokes and deaths, and trials in heart failure found no clear gain. All of these are among the study cards above.
Sources
- EFSA Panel on Nutrition, Novel Foods and Food Allergens (NDA). Dietary reference values for sodium. EFSA J. 2019.
- He FJ, Li J, Macgregor GA. Effect of longer term modest salt reduction on blood pressure: Cochrane systematic review and meta-analysis of randomised trials. BMJ. 2013.
- Graudal NA, Hubeck-Graudal T, Jurgens G. Effects of low sodium diet versus high sodium diet on blood pressure, renin, aldosterone, catecholamines, cholesterol, and triglyceride. Cochrane Database Syst Rev. 2020.
How much sodium do you need?
In the US, the adequate intake for adults is 1,500 mg of sodium a day. In the EU, EFSA calls 2,000 mg a day safe and adequate. Both bodies say most people eat far more. The US advises cutting back above 2,300 mg a day, and WHO advises under 2,000 mg, which is 5 g of salt.
These numbers are not measured requirements. NASEM set the adequate intake from the lowest sodium levels tested in trials, where no deficiency symptoms were reported. It also used the best-designed balance study, in which 1,525 mg a day gave roughly neutral balance even with daily heat stress.
The 2,300 mg figure is a different kind of number, called a chronic disease risk reduction intake. It is the level above which cutting back is expected to lower the risk of chronic disease.
Apart from chronic disease, NASEM found too little evidence of harm from high sodium to set a tolerable upper intake level (a safe daily maximum). EFSA set none in its 2005 review because of insufficient data. EFSA also judged that its data could not give an average requirement.
Pregnancy and breastfeeding do not raise the target. NASEM’s adequate intake is 1,500 mg a day for both. EFSA says 2,000 mg is safe and adequate for pregnant and breastfeeding women, because the body’s own adaptations cover the extra sodium needed. For adults over 70, NASEM keeps the same 1,500 mg adequate intake and 2,300 mg risk-reduction level.
Children get lower numbers, scaled from the adult values by energy needs, shown in the table below. Hard exercise or heavy sweating in heat can raise needs. NASEM says sweat sodium varies widely, from 230 to 3,358 mg per liter, with an average of 1,012 mg per liter.
Almost everyone is above these numbers. The FDA puts average US intake at about 3,400 mg a day. NASEM found that median intake was above the 2,300 mg level in every adult group.
The FDA’s voluntary targets aim at food makers, not at you. Its 2021 final guidance for packaged and restaurant foods was designed to cut average intake by about 12%, from about 3,400 to 3,000 mg. Its August 2024 draft Phase II targets for 163 food categories would bring intake to about 2,750 mg, still above the 2,300 mg limit. Phase II was still a draft on the FDA page current as of November 2024.
Units trip people up. US labels list sodium, but EU labels list salt, calculated as sodium multiplied by 2.5. The EU Reference Intake is 6 g of salt, which equals 2,400 mg of sodium by that rule. WHO’s shortcut is that 1 g of salt holds 400 mg of sodium.
Sodium: recommended intake per day
US: Adequate Intake (NASEM). EU: Adequate Intake / Safe and Adequate Intake (EFSA).
| Age and sex | US (AI) | EU (SSI) |
|---|---|---|
| Men, 31–50 years | 1,500 mg | 2,000 mg |
| Women, 31–50 years | 1,500 mg | 2,000 mg |
All ages, pregnancy and breastfeeding
| Age and sex | US (AI) | EU (AI/SSI) |
|---|---|---|
| Infants 0–6 months | 110 mg | None set |
| Infants 7–11 months | None set | 200 mg |
| Infants 7–12 months | 370 mg | None set |
| Children 1–3 years | 800 mg | 1,100 mg |
| Children 4–6 years | None set | 1,300 mg |
| Children 4–8 years | 1,000 mg | None set |
| Children 7–10 years | None set | 1,700 mg |
| Females 9–13 years | 1,200 mg | None set |
| Males 9–13 years | 1,200 mg | None set |
| Children 11–17 years | None set | 2,000 mg |
| Females 14–18 years | 1,500 mg | None set |
| Males 14–18 years | 1,500 mg | None set |
| Adults 18+ years | None set | 2,000 mg |
| Females 19–30 years | 1,500 mg | None set |
| Males 19–30 years | 1,500 mg | None set |
| Females 31–50 years | 1,500 mg | None set |
| Males 31–50 years | 1,500 mg | None set |
| Females 51–70 years | 1,500 mg | None set |
| Males 51–70 years | 1,500 mg | None set |
| Females >70 years | 1,500 mg | None set |
| Males >70 years | 1,500 mg | None set |
| Pregnancy 14–18 years | 1,500 mg | None set |
| Pregnancy | None set | 2,000 mg |
| Pregnancy 19–30 years | 1,500 mg | None set |
| Pregnancy 31–50 years | 1,500 mg | None set |
| Lactation 14–18 years | 1,500 mg | None set |
| Lactation | None set | 2,000 mg |
| Lactation 19–30 years | 1,500 mg | None set |
| Lactation 31–50 years | 1,500 mg | None set |
Chronic Disease Risk Reduction Intake (CDRR)
US (NASEM 2019): lowering intakes that are above this level reduces the risk of chronic disease. An upper target, not a requirement.
| Age | US (CDRR) |
|---|---|
| Children 1–3 years | 1,200 mg |
| Children 4–8 years | 1,500 mg |
| Adolescents 9–13 years | 1,800 mg |
| Adolescents 14–18 years | 2,300 mg |
| Adults 19+ years | 2,300 mg |
EU and US age bands differ; "None set" means that body sets no value for the group. Label reference: FDA Daily Value 2,300 mg, EU Reference Intake 2,400 mg.EU and US age bands differ; "None set" means that body sets no value for the group. Label reference: EU Reference Intake 2,400 mg, FDA Daily Value 2,300 mg.
Sodium deficiency: signs and who is at risk
Real sodium deficiency from diet is rare. EFSA says sodium salts are in almost every food, and the body cuts its losses in urine, stool and sweat when intake is low. WHO calls deficiency extremely unlikely in healthy people. NASEM found no deficiency symptoms in the low-sodium groups of the trials it reviewed, which in eight trials went below 1,800 mg a day.
Low blood sodium, called hyponatremia, is a different problem: a serum (blood) sodium under 135 mmol/L. A European guideline calls it the most common disorder of fluid and electrolyte balance in clinical practice. It usually reflects water and hormone problems, not too little sodium in the diet. EFSA says it is seldom due to inappropriate sodium intake.
Symptoms progress from malaise, nausea, vomiting and headache to lethargy, impaired consciousness, seizures and coma. Severe symptoms are generally linked to levels under 120 mmol/L, when the brain swells.
Who is at risk? Endurance athletes who drink more than thirst calls for. A 2017 review says overdrinking and non-osmotic release of the hormone vasopressin are the most common causes of hyponatremia during exercise. The marathon and Ironman studies above fit that.
People taking thiazide diuretics (water pills) are another group. In a Swedish cohort of 159,080 adults, 0.80% of new thiazide users had profound hyponatremia (under 125 mEq/L) over two years. That compares with 0.46% of new users of calcium channel blockers. Among thiazide users aged 80 or older, it was 2.40%.
An older case-control study found the risk doubled with each 10 years of age and was higher in lighter people. The test is a blood measurement of serum sodium, where the usual range outside cells is 135 to 145 mmol/L. A low or high result needs a doctor’s reading, because treatment depends on the cause.
Sources
- National Academies of Sciences, Engineering, and Medicine. Dietary Reference Intakes for Sodium and Potassium. National Academies Press. 2019.
- EFSA Panel on Nutrition, Novel Foods and Food Allergens (NDA). Dietary reference values for sodium. EFSA J. 2019.
- Sodium reduction. World Health Organization. Fact sheet, 11 May 2026.
- Sodium reduction in the food supply. US Food and Drug Administration. Content current as of November 1, 2024.
- FDA issues sodium reduction final guidance. US Food and Drug Administration constituent update. October 13, 2021.
- Regulation (EU) No 1169/2011 on the provision of food information to consumers. Annex I and Annex XIII.
- Spasovski G, Vanholder R, Allolio B, et al. Clinical practice guideline on diagnosis and treatment of hyponatraemia. Eur J Endocrinol. 2014.
- Hew-Butler T, Loi V, Pani A, et al. Exercise-Associated Hyponatremia: 2017 Update. Front Med (Lausanne). 2017.
- Bergh Fahlén C, Falhammar H, Skov J, et al. Thiazides and Risk of Hyponatremia by Age and Sex. JAMA Netw Open. 2026.
- Chow KM, Szeto CC, Wong TY, et al. Risk factors for thiazide-induced hyponatraemia. QJM. 2003.
Forms of sodium: absorption and effects
Nearly all the sodium people eat is sodium chloride, which is table salt, plus smaller amounts from other sodium compounds in food and additives. Table salt, kosher salt and most sea salts are about 40% sodium by weight, says the American Heart Association (AHA). And 1 g of salt holds 400 mg of sodium, says WHO.
Sea salt and Himalayan pink salt keep trace minerals such as magnesium, potassium and calcium, which other foods also supply. Coarse crystals can hold less sodium per teaspoon, simply because fewer fit on the spoon. The AHA’s bottom line is that the sodium content of different salts is generally similar, and that total sodium intake is what matters.
The honest bottom line: we found one small randomized trial that compared a specialty salt with table salt. It found no difference in blood pressure. Iodine is the practical difference. WHO says all salt consumed should be iodized, and iodized salt is a major source of iodine in the US.
One analysis found that labeled iodized salt varied widely in iodine, so if you rely on salt for iodine, know which salt you use. We found no source that compared the iodine in sea salt or other specialty salts with table salt.
Sodium also comes from additives. The FDA names MSG, baking soda (sodium bicarbonate), sodium nitrite and sodium benzoate, and the AHA adds sodium citrate, phosphate and lactate. These add smaller amounts than salt itself. Replacing some salt with MSG lowers sodium in a recipe, since MSG holds about a third of the sodium of table salt.
In 2017 EFSA set a group acceptable daily intake of 30 mg per kg of body weight for glutamic acid and its salts. Earlier evaluations had left this “not specified”. EFSA estimated that intake from all dietary sources, including glutamate naturally in food, was above that figure for every group at the high end. Potassium-enriched salt substitutes are covered in the table and in the safety section below.
| Form | Share of the mineral by weight | What studies show | Source |
|---|---|---|---|
| Table salt (sodium chloride), plain or iodized | About 40% sodium; 39.34 g per 100 g | The form behind most of the sodium in food. 1 g holds 400 mg of sodium. US iodized salt is labeled at 45 mg of iodine per kg, but 47 of 88 freshly opened containers held less than the FDA’s recommended range. | 1, 2, 4, 5 |
| Sea salt and kosher salt | About 40% for table salt, kosher salt and most sea salts | We found no trial. Sea salt keeps trace magnesium, potassium and calcium that other foods also supply, and coarse crystals hold less sodium per teaspoon. | 1 |
| Himalayan pink salt | Not stated | A crossover trial of 17 women with hypertension found no difference from table salt in blood pressure or urinary sodium. The AHA says sodium content is generally similar. | 1, 3 |
| Sodium bicarbonate (baking soda) | Not stated | Used as a leavening agent in baked goods. In 300 older adults with advanced kidney disease, up to 3 g a day did not improve physical function and caused more adverse events than placebo. | 8, 9, 12 |
| Monosodium glutamate (MSG) | About 12.28 g of sodium per 100 g, about a third of salt | Replacing part of the salt with MSG lowers sodium in a recipe. EFSA set a group ADI of 30 mg per kg of body weight in 2017. A systematic review found headache results inconsistent, with high-concentration studies not properly blinded. | 5, 6, 7 |
| Sodium citrate, phosphates, nitrite and other sodium additives | Not stated | The FDA names sodium nitrite and sodium benzoate, and the AHA names citrate, phosphate and lactate, among sodium-containing ingredients. NASEM adds that phosphates, lactate and diacetate are common in processed meats. We found no trial of these additives and blood pressure. | 1, 9, 12 |
| Potassium-enriched salt substitutes | SSaSS used 75% sodium chloride and 25% potassium chloride by mass | Across 26 trials, 3% to 77% of the sodium chloride was replaced. Salt substitutes lowered systolic pressure by 4.76 mm Hg and raised blood potassium by 0.12 mmol/L. SSaSS found fewer strokes and deaths. | 10, 11 |
Here are the studies that compare or test forms, strongest evidence first, 4 in all.
All 4 studies, strongest evidence first
Sodium bicarbonate did not improve physical function in advanced kidney disease
In this double-blind trial, 300 adults aged 60 or older with advanced kidney disease took sodium bicarbonate or a placebo. They took up to 3 g a day for up to 2 years, and neither they nor the researchers knew which. At 12 months the physical performance score was no better on bicarbonate: 8.3 against 8.8 points (adjusted difference −0.4). Adverse events were more common on bicarbonate, 457 against 400. This is a medical treatment for acidosis (too much acid in the blood) in kidney disease, not a kitchen use of baking soda.
Himalayan salt did not differ from table salt for blood pressure
In this crossover trial, 17 women with hypertension used each salt in turn. Afterwards, systolic pressure was 117 against 119 mm Hg, diastolic 68.5 against 71, and urine sodium 159 against 155 mEq a day. None of these differences was clear. It is a very small trial, and the authors note that clinical evidence for the popular health claims about Himalayan salt was lacking.
A review could not confirm that MSG causes headache
This systematic review looked at human studies of monosodium glutamate (MSG). In five papers (six studies) that gave MSG with food, none found a clear difference in headache, except in women in one study. In five papers (seven studies) without food, four found a difference. But many used MSG solutions above 2%, which are easy to taste and so not properly blinded. The first author lists the International Glutamate Technical Committee as his affiliation.
In 88 iodized salts, 47 held less iodine than the FDA advises
Volunteers sent in freshly opened US containers of iodized table salt for chemical analysis. The median was 44.1 mg of iodine per kg (range 12.7 to 129), against 45 on the labels, and 6 containers exceeded the FDA range. Iodine varied widely within single containers. It was lost in high humidity, while light or dry heat had little effect.
Sources
- Sodium sources: where does all that sodium come from?. American Heart Association. Last reviewed July 15, 2025.
- Sodium reduction. World Health Organization. Fact sheet, 11 May 2026.
- Loyola IP, Sousa MF, Jardim TV, et al. Comparison between the Effects of Hymalaian Salt and Common Salt Intake on Urinary Sodium and Blood Pressure in Hypertensive Individuals. Arq Bras Cardiol. 2022.
- Dasgupta PK, Liu Y, Dyke JV. Iodine nutrition: iodine content of iodized salt in the United States. Environ Sci Technol. 2008.
- Maluly HDB, Arisseto-Bragotto AP, Reyes FGR. Monosodium glutamate as a tool to reduce sodium in foodstuffs: Technological and safety aspects. Food Sci Nutr. 2017.
- Mortensen A, Aguilar F, Crebelli R, et al. Re-evaluation of glutamic acid (E 620), sodium glutamate (E 621), potassium glutamate (E 622), calcium glutamate (E 623), ammonium glutamate (E 624) and magnesium glutamate (E 625) as food additives. EFSA J. 2017.
- Obayashi Y, Nagamura Y. Does monosodium glutamate really cause headache? : a systematic review of human studies. J Headache Pain. 2016.
- BiCARB study group. Clinical and cost-effectiveness of oral sodium bicarbonate therapy for older patients with chronic kidney disease and low-grade acidosis (BiCARB): a pragmatic randomised, double-blind, placebo-controlled trial. BMC Med. 2020.
- Sodium in your diet. US Food and Drug Administration.
- Neal B, Wu Y, Feng X, et al. Effect of Salt Substitution on Cardiovascular Events and Death. N Engl J Med. 2021.
- Brand A, Visser ME, Schoonees A, et al. Replacing salt with low-sodium salt substitutes (LSSS) for cardiovascular health in adults, children and pregnant women. Cochrane Database Syst Rev. 2022.
- National Academies of Sciences, Engineering, and Medicine. Dietary Reference Intakes for Sodium and Potassium. National Academies Press. 2019.
Is sodium safe? Supplements, dose and interactions
Sodium from food is safe for most people at the amounts that meet needs, and the concern is long-term excess.
The US sets no tolerable upper intake level for sodium. NASEM found too little evidence of toxicity apart from chronic disease risk. It says the risk the old upper level covered is now captured by the 2,300 mg risk-reduction level. EFSA set none in 2005 either, while noting strong evidence that sodium raises blood pressure.
Very high, sudden intakes can cause high blood sodium (hypernatremia, over 145 mmol/L) and death, but only in extreme cases such as salt poisoning. NASEM adds that sodium eaten in a concentrated form might do harm that current evidence cannot put a number on.
EFSA’s 2005 review also concluded that sodium itself does not cause cancer. But high salt intake could raise susceptibility to carcinogens such as nitrosamines, and to infection with Helicobacter pylori, a stomach bacterium.
- Salt tablets and endurance sport. Most people do not need them. In the Ironman trial, tablets that added 3.6 g of sodium did not change blood sodium. NASEM says heavy sweaters in heat may need more than the adequate intake. If you do long events in heat, ask a sports doctor.
- Oral rehydration solutions. These pair sodium with glucose to treat dehydration from diarrhea. A Cochrane review found a lower-concentration version worked better in children. They are a treatment for illness, so follow the label or a doctor’s advice.
- Salt substitutes. Potassium chloride blends raised blood potassium by 0.12 mmol/L in a Cochrane review, but all trials excluded people in whom extra potassium is harmful. A 2024 review, whose authors include the SSaSS lead investigator, proposes these reasons to avoid them: advanced kidney disease, potassium supplements and potassium-sparing diuretics. A 2020 review lists possible hyperkalemia as the main risk, especially with conditions that impair potassium removal, such as chronic kidney disease. It says evidence on how often this happens is insufficient. Ask a doctor first if any of these apply.
- Medicines and conditions. Thiazide diuretics can lower blood sodium, mostly in older adults and women. People with heart failure or kidney disease should follow their care team’s sodium advice. Trials of sodium restriction in heart failure have not shown fewer deaths or hospital stays. In a small trial of people with kidney disease taking an ACE inhibitor, a low-sodium diet lowered protein in the urine. Some over-the-counter and prescription medicines also contain sodium, so check labels.
- Stomach cancer. Cohort studies link high salt intake to stomach cancer, but they cannot prove cause.
How to get less sodium
- Start with packaged and restaurant food. More than 70% of US sodium comes from processed, packaged and prepared foods. Bread, pizza, sandwiches and cold cuts lead the NASEM survey table. The FDA suggests buying fresh meat, poultry and seafood, and rinsing canned beans, tuna and vegetables, which removes some of the sodium.
- Read the label. In the US, 5% of the Daily Value or less per serving is low. And 20% or more is high. “Low sodium” means 140 mg or less per serving. EU rules allow “low sodium” for no more than 0.12 g of sodium per 100 g. Similar foods can differ a lot, so compare.
- Give your taste time, and consider a potassium salt substitute. The FDA says people usually do not notice cuts of about 10% and that taste adapts gradually. WHO suggests replacing table salt with lower-sodium salt substitutes that contain potassium, with the kidney and medicine cautions above.
Sources
- National Academies of Sciences, Engineering, and Medicine. Dietary Reference Intakes for Sodium and Potassium. National Academies Press. 2019.
- EFSA Panel on Nutrition, Novel Foods and Food Allergens (NDA). Dietary reference values for sodium. EFSA J. 2019.
- Sodium in your diet. US Food and Drug Administration.
- Sodium reduction in the food supply. US Food and Drug Administration. Content current as of November 1, 2024.
- Sodium reduction. World Health Organization. Fact sheet, 11 May 2026.
- Sodium sources: where does all that sodium come from?. American Heart Association. Last reviewed July 15, 2025.
- Annex: nutrition claims. Regulation (EC) No 1924/2006 on nutrition and health claims made on foods.
- Xu X, Zeng L, Jha V, et al. Potassium-Enriched Salt Substitutes: A Review of Recommendations in Clinical Management Guidelines. Hypertension. 2024.
- Greer RC, Marklund M, Anderson CAM, et al. Potassium-Enriched Salt Substitutes as a Means to Lower Blood Pressure: Benefits and Risks. Hypertension. 2020.
- Hew-Butler T, Loi V, Pani A, et al. Exercise-Associated Hyponatremia: 2017 Update. Front Med (Lausanne). 2017.
Frequently asked questions about sodium
How much sodium is too much in a day?
Above 2,300 mg a day, the US National Academies and the Dietary Guidelines advise cutting back. WHO advises under 2,000 mg, which is 5 g of salt. The average American eats about 3,400 mg, the FDA says. The 2,300 mg limit is about 1 teaspoon of table salt, counting all sources and not just the shaker.
What is the difference between salt and sodium?
Salt is sodium chloride, which is about 40% sodium and 60% chloride by weight. That means 1 g of salt holds 400 mg of sodium and 5 g holds 2,000 mg. US labels list sodium, while EU labels list salt, calculated as sodium multiplied by 2.5.
Is sea salt healthier than table salt?
There is no evidence that it is. Table salt, kosher salt and most sea salts are about 40% sodium by weight. The AHA says total sodium intake is what matters, whatever the salt. Sea salt may carry trace magnesium, potassium and calcium, which other foods also supply. In a small crossover trial of 17 women with hypertension, Himalayan salt did not change blood pressure or urine sodium compared with table salt.
Can you eat too little sodium?
In healthy people it is rare, because the body holds on to sodium when intake is low. The low-sodium groups in the trials NASEM reviewed reported no deficiency symptoms, though evidence below 1,500 mg a day is limited. Some large cohort studies linked low estimated sodium intake to more heart events. The National Academies and the AHA say measurement problems and reverse causality may explain that J-shaped pattern, and the question is still debated. Low blood sodium is usually caused by water, drugs or illness, not by the diet.
Are potassium salt substitutes safe?
For most people they appear to be, but not for everyone. In SSaSS, with 20,995 people, serious adverse events put down to high blood potassium were not clearly higher (3.35 against 3.30 per 1000 person-years). But the trials excluded people for whom extra potassium is harmful. People with advanced kidney disease, or who take potassium supplements or potassium-sparing diuretics, should ask a doctor first.
Which foods are highest in sodium?
In our USDA-based ranking, shrimp leads per serving with 805 mg in 3 oz. Scallops (333 mg), sardines (282 mg per can) and olives (162 mg in five large olives) follow. Per 100 g, shrimp leads with 947 mg, ahead of olives with 735 mg. Shrimp is often treated with sodium-based additives during processing. Still, these foods are not where most sodium comes from: bread, pizza, sandwiches and cold cuts lead US intake in the National Academies’ survey table. More than 70% of sodium comes from packaged, prepared and restaurant food, the FDA says.
How quickly does cutting sodium lower blood pressure?
For many people, within a week. In a 2023 crossover trial of 213 adults, a low-sodium week lowered mean arterial pressure in 73.4% of people, against a high-sodium week. A meta-analysis found that trials shorter than 15 days showed less than half the effect per 50 mmol cut of longer trials. So the full effect takes longer to show.
Do I need salt tablets when I exercise?
Most people do not. In a trial of 413 Ironman triathletes, salt tablets did not change blood sodium. Low blood sodium in endurance events is mostly linked to drinking more than thirst calls for. In a Boston Marathon study, 13% of finishers tested had low blood sodium, and weight gain during the race was linked to it. Sweat sodium varies widely, so people who sweat heavily in heat may need more than the adequate intake and can ask a sports doctor.