11 food
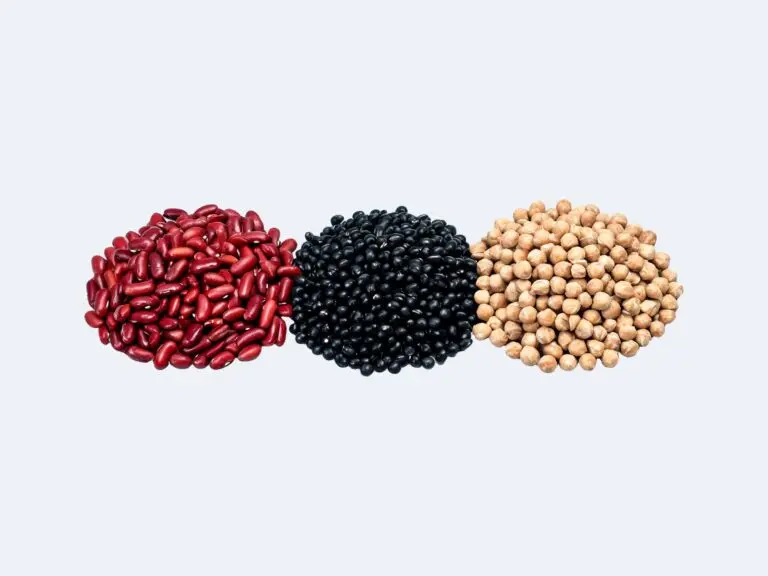
Beans and Legumes
15 beans and legumes compared on protein, fiber, folate, iron and potassium per serving from USDA data, with links to every profile.
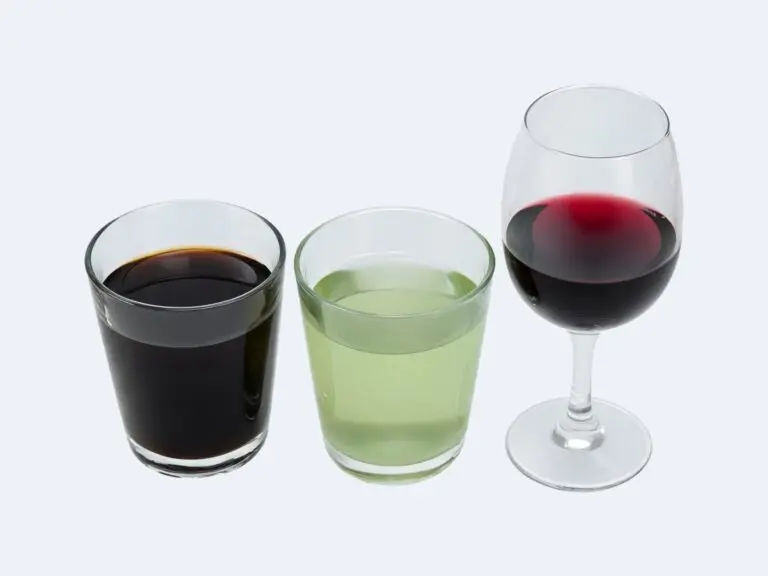
Beverages
Coffee, green tea, red wine and beer compared on calories, caffeine, alcohol and minerals per cup or glass from USDA data. Each links to its profile.
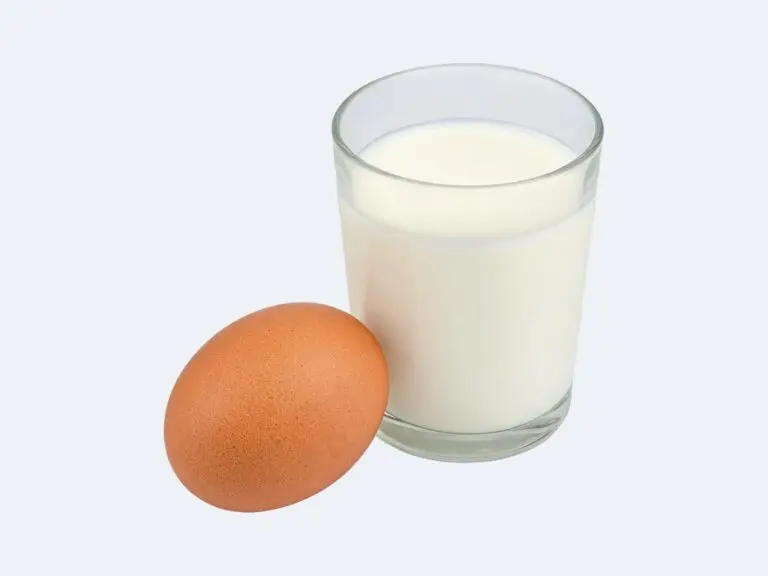
Eggs and Dairy
Eggs and 2% milk compared on protein, calcium, choline, vitamin B12 and cholesterol per serving, from USDA data, with links to each profile.
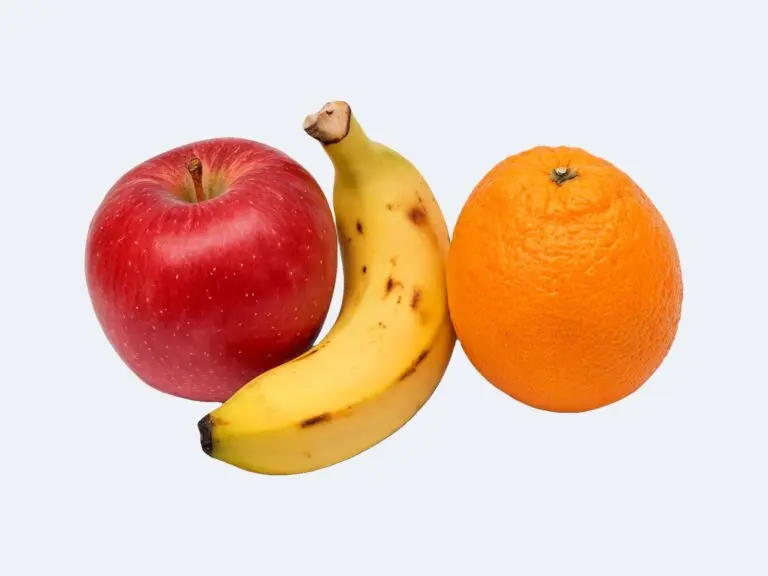
Fruits
25 fruits compared on vitamin C, fiber, potassium and sugars per serving from USDA data. See which lead each nutrient, with links to every profile.
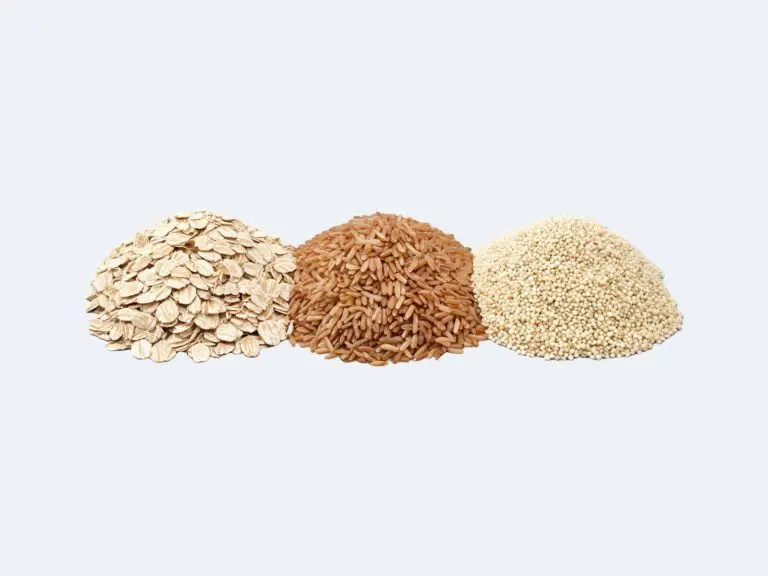
Grains
10 grains compared on fiber, protein, magnesium, manganese and iron per serving from USDA data, with whole versus refined and links to every profile.
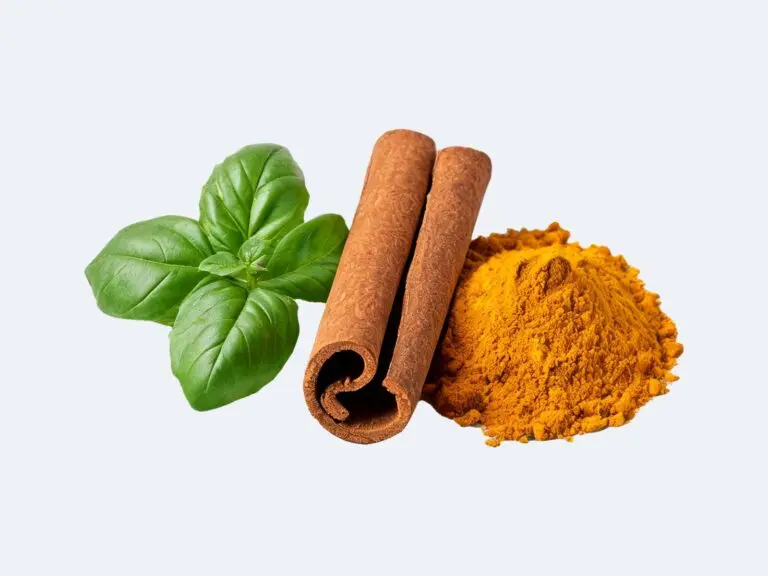
Herbs and spices
23 herbs and spices compared per teaspoon and per 100 g on vitamin K, manganese, iron and antioxidant capacity from USDA data. Each links to its profile.
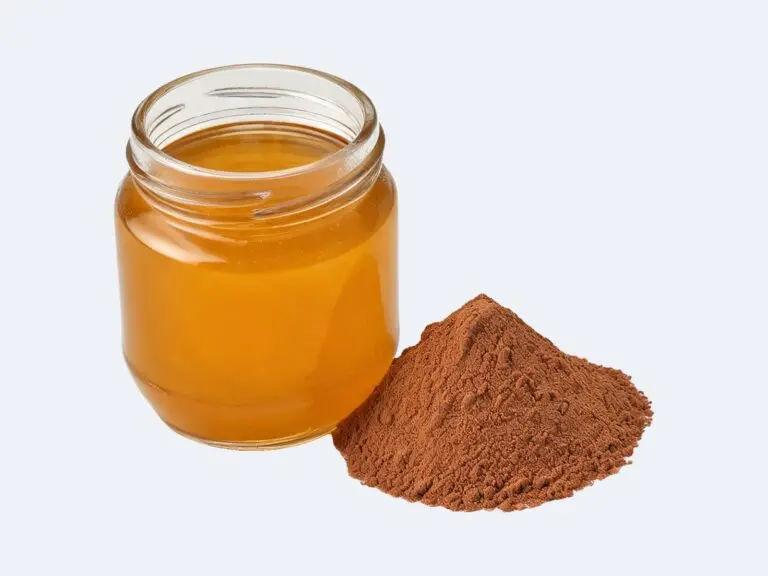
Misc
Cocoa powder and honey compared on fiber, magnesium, iron, sugars and calories per serving from USDA data, plus the honey versus sugar facts.
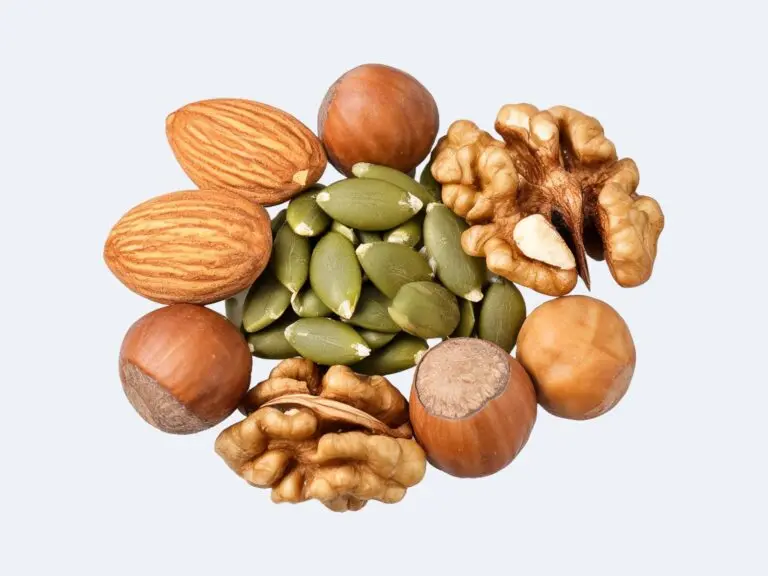
Nuts and Seeds
19 nuts and seeds compared on protein, fiber, magnesium, vitamin E and omega-3 per serving, from USDA data, with links to every profile.
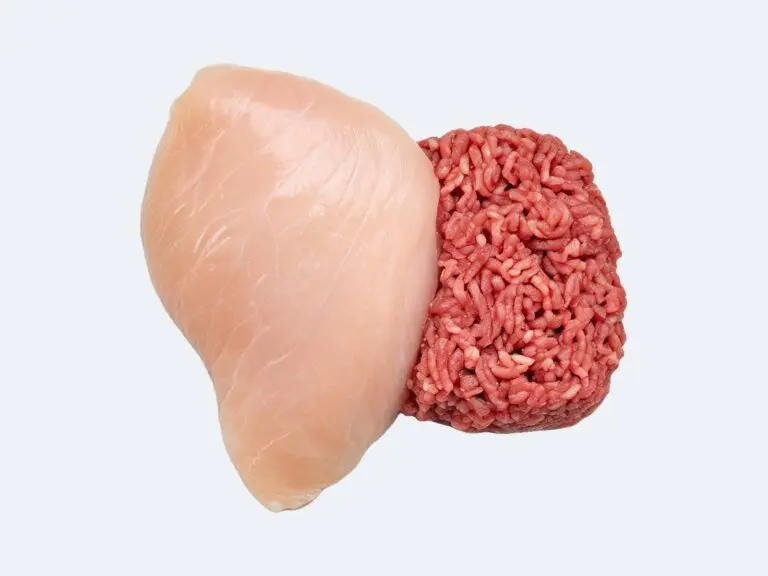
Poultry and Meats
Chicken breast, chicken drumstick, ground beef and ground lamb compared on protein, fat, iron, zinc and B12 per serving. All from USDA data, with links to each.
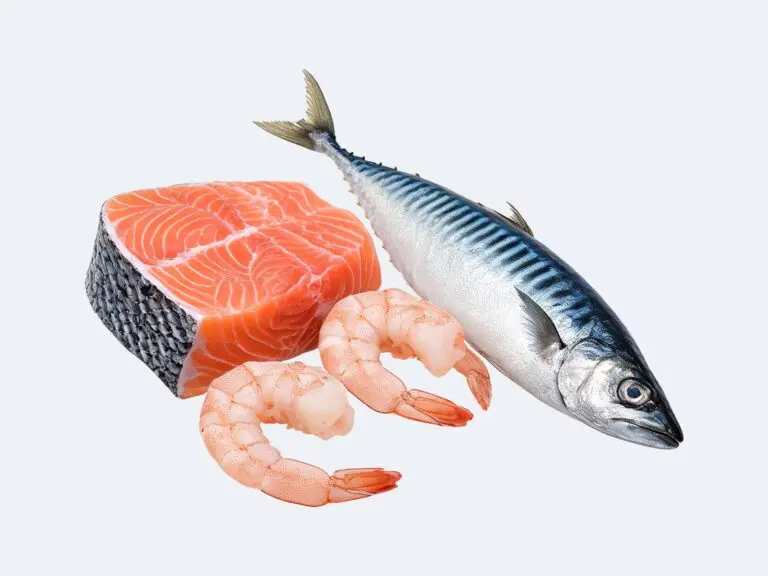
Seafood
10 fish and shellfish compared on protein, omega-3, vitamin B12 and selenium per serving from USDA data. You also get a mercury note and links to each profile.
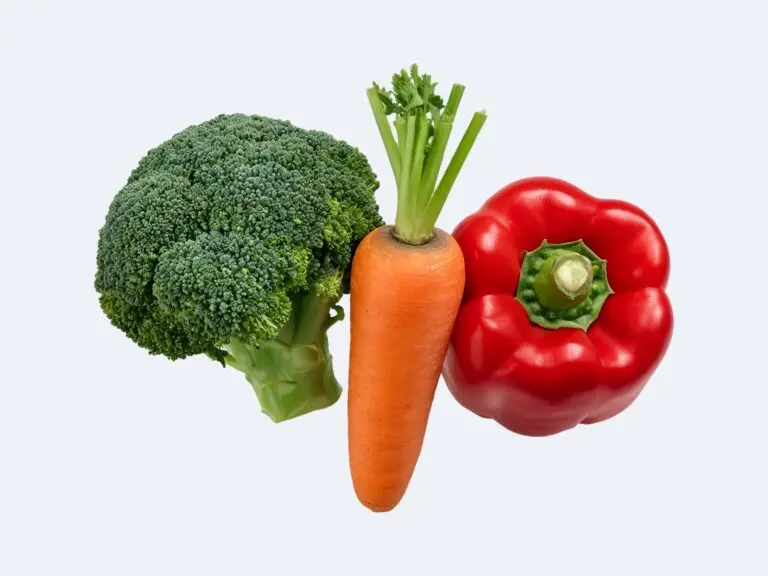
Vegetables
29 vegetables compared on fiber, vitamin C, vitamin K and potassium per serving from USDA data. See which lead each nutrient, with links to every profile.


