
Starch is how plants store energy: long chains of glucose packed into the grains, potatoes, beans, corn and bananas we eat. It is one of the three kinds of carbohydrate, next to the sugars and the fiber. It is made of two molecules: amylose, a straight chain, and amylopectin, a branched one.
Enzymes in saliva and in the pancreas cut starch into short pieces, including maltose, and the gut lining finishes the job as glucose. The National Academies (US science advisers) set a recommended intake of 130 g a day for all carbohydrate together. It is based on the glucose the brain uses, and there is no separate amount for starch.
Most readers have not been told that not all starch is digested. In seven people whose small intestine drained into a bag (an ileostomy), 4% or less of starch in cornflakes, white bread and oats escaped digestion. That small share feeds gut bacteria, and it is the reason resistant starch exists.
It also changes with cooking. In one lab analysis, white rice cooled for 24 hours at 4 °C and reheated held 1.65 g of resistant starch per 100 g. Fresh rice held 0.64 g.
And “starchy” says little about blood sugar. The glycemic index ranks how much a food raises blood sugar against a reference food. In the National Academies table (white bread = 100), a baked potato scored 121, table sugar 92 and kidney beans 42.
This page sets out 25 studies and reports at their real evidence level, including the trials that found nothing. One finding is strong: the EU claim for resistant starch and the blood glucose rise after a meal. Resistant starch trials mostly gave 15 to 40 g a day as a supplement or a modified flour, far more than ordinary foods supply.
The evidence for whole grains, potatoes and white rice comes from cohorts, studies that follow large groups for years, and they cannot prove cause. We say where industry funded the work.
Health effects of starch
The top findings from 25 studies, strongest evidence first
What the stars mean
- Strong. Several randomized trials, pooled in a meta-analysis, point the same way, or regulators (FDA or EFSA) have approved the claim.
- Moderate. Good randomized trials support it, but there are fewer of them, or their results vary.
- Limited. Small, short or single trials, or mixed results. Promising, but it needs confirmation.
Population and lab studies get no stars: they show a link or a mechanism, not proof.
How we rate evidence →- ★★★Smaller blood sugar rise after a mealSwapping digestible starch for resistant starch in a meal lowers the blood sugar rise after it, as an EU-authorized claim describes. Trials in people with type 2 diabetes or prediabetes agree, and the claim needs resistant starch to be at least 14% of total starch.
- ★★Slightly lower fasting blood sugarAcross 19 trials, resistant starch lowered fasting blood sugar a little (0.09 mmol/L). The drop was larger above 28 g a day (0.16 mmol/L).
- ★★Lower HbA1c on low glycemic index dietsIn people with diabetes, diets that raise blood sugar slowly (low glycemic index or load) lowered HbA1c, average blood sugar, by 0.31%. This covers whole diets, not starch alone.
- ★★No effect on colorectal cancer in Lynch syndromeIn people with Lynch syndrome, an inherited cancer risk, 30 g daily of resistant starch for up to 4 years did not change colorectal cancer. Follow-up to 20 years agreed (52 cases against 53 on placebo).
- ★Mixed effects on insulin sensitivitySmall trials found higher insulin sensitivity with resistant starch in men with a large waist (15 to 30 g a day) and 10 healthy adults. It did not change in women with a large waist, or in 17 adults with type 2 diabetes taking 40 g a day.
All 20 studies, strongest evidence first
EU claim: swapping in resistant starch lowers the after-meal glucose rise
The claim is listed in the annex to Regulation (EU) No 432/2012. Its wording: “Replacing digestible starches with resistant starch in a meal contributes to a reduction in the blood glucose rise after that meal”. It may be used only for food in which resistant starch replaces digestible starch to reach at least 14% of total starch. The basis is an opinion from EFSA, the EU’s food safety agency (EFSA Journal 2011;9(4):2024, claim ID 681), from 2011. The claim covers the glucose rise after one meal only, not long-term blood sugar, weight or disease.
19 trials: resistant starch lowered fasting glucose 0.09 mmol/L
This review pooled randomized trials comparing resistant starch (not type 1) with digestible starch. The drop, in mmol/L (a unit for blood levels), was larger above 28 g a day (−0.16) and in trials over 8 weeks (−0.12). HOMA-IR, an index of insulin resistance, fell by 0.33, but fasting insulin and the other insulin measures did not change significantly. The authors call the effects moderate, and the fasting glucose change is small.
Prediabetes and diabetes: resistant starch types 1 and 2 cut after-meal glucose
This systematic review covered 36 randomized trials in 982 people with type 2 diabetes or prediabetes; 31 of the 36 went into the meta-analysis. After a single meal, the effect sizes were −0.54 for type 1 (starch locked inside intact plant cells) and −0.96 for type 2 (high-amylose starch). In longer trials both types lowered glucose after meals (−0.38 and −0.29), and type 2 also lowered fasting glucose (−0.39) and fasting insulin (−0.40). Types 3, 4 and 5 had too few trials to judge, and the authors report no commercial or financial conflicts.
Diabetes: low glycemic index or load diets lowered HbA1c 0.31%
This meta-analysis of 29 comparisons in 1,617 people covered whole diets for 3 weeks or more, so it is not about starch alone. Results varied a lot (I2 75%); certainty was high for HbA1c and moderate for most other outcomes. Fasting glucose, LDL (“bad”) cholesterol, triglycerides, body weight and systolic blood pressure fell too; insulin and HDL (“good”) cholesterol did not change. Several authors disclose food industry research funding, and the Canadian Sugar Institute co-funded the first author’s fellowship.
Lynch syndrome: 30 g resistant starch daily did not change colorectal cancer
In the CAPP2 trial, people with Lynch syndrome, an inherited cancer risk, took 30 g of resistant starch or a dummy starch daily. In this two-by-two, double-blind design they also took 600 mg aspirin or placebo, for up to 4 years. After a median 52.7 months, colorectal cancer had developed in 27 of 463 on resistant starch and 26 of 455 on placebo (hazard ratio 1.40). The authors say resistant starch did not match the protective effect that fiber-rich diets seem to have. Funders included the European Union, Cancer Research UK, Bayer and National Starch and Chemical Co.
Nine trials: whole grain diets did not change total cholesterol
This Cochrane review covered trials of 12 weeks or more in 1,414 people. Against refined grain or lower whole grain diets, the mean difference in total cholesterol was 0.07. No trial reported cardiovascular deaths or events, none lasted longer than 16 weeks, and all had an unclear or high risk of bias. The authors judge the evidence too thin to show an effect on cardiovascular outcomes, blood lipids or blood pressure. Four trials had independent funding; the others were funded in whole or part by groups with commercial interests in cereals.
20-year follow-up: no colorectal effect; other Lynch cancers 27 against 48
This second CAPP2 report covers 463 people on 30 g a day of resistant starch and 455 on placebo, for up to 4 years. It adds the planned 10-year follow-up plus registry data to 20 years in England, Wales and Finland. Colorectal cancer struck 52 on resistant starch and 53 on placebo (hazard ratio 0.92); cancers outside the colon had a hazard ratio of 0.54. Those included 5 upper gastrointestinal cancers against 21. Colorectal cancer was the trial’s main question, so the other cancers are a secondary finding, and we found no second trial testing it.
In men, 15 to 30 g resistant starch raised insulin sensitivity
11 men and 22 women with a large waist took 0 (control), 15 or 30 g a day of high-amylose maize type 2 resistant starch. Each lasted 4 weeks, in random order with 3-week breaks, and the trial was double-blind. In men, insulin sensitivity was higher on both doses than on control (6.90 and 7.13 against 4.66, in units of 10⁻⁵ pmol⁻¹·L⁻¹·min⁻¹). It did not differ in women, and the authors call for work on why. Some authors work for National Starch, the maker of the product, or for a research firm that receives its grants.
10 adults: 30 g resistant starch raised insulin sensitivity (9.7 against 8.5)
The healthy adults took 30 g a day of resistant starch or a placebo for 4 weeks; the values above are from a clamp test. Insulin sensitivity during a meal test was 33% higher, and insulin-adjusted muscle glucose clearance 44% higher, with lower insulin levels. Fasting ghrelin and the short-chain fatty acids acetate and propionate were higher, and the supplement was well tolerated. Only 10 people were studied, and the authors say studies in insulin-resistant people were needed.
Type 2 diabetes: 40 g resistant starch did not improve insulin sensitivity
17 adults with well-controlled diabetes took 40 g a day of high-amylose maize type 2 resistant starch or placebo, 12 weeks each. A 12-week break came between them. After 12 weeks on the starch, blood glucose after a test meal was lower and the gut hormone GLP-1 rose more. But liver and peripheral insulin sensitivity and HbA1c did not change; the authors see the benefit in meal handling, possibly through GLP-1.
High resistant starch raised daily stool weight, 138 to 197 g
The 11 adults ate two diets for 3 weeks each, with 5.0 or 39.0 g a day of resistant starch on average. On the high diet, stool acidity fell (pH from 6.9 to 6.3), daily butyrate excretion doubled (+100%) and acetate rose by 72%. Participants reported more flatulence and easier defecation. The study is from 1995 and small, and it measured stool markers, not disease.
2 weeks: potato resistant starch raised butyrate and other fatty acids most
For 2 weeks, 174 healthy young adults added resistant starch from potatoes or maize, chicory inulin, or an accessible corn starch as the control. Maize resistant starch and inulin changed the gut bacteria but did not raise butyrate, a short-chain fatty acid, significantly. Who responded depended on the bacteria a person already carried, such as Ruminococcus bromii. The study measured gut chemistry, not health outcomes.
In 14 adults, high salivary amylase went with lower glucose after starch
Seven high- and seven low-amylase healthy adults (1 standard deviation above or below the mean) drank starch and, on another day, glucose. After starch, the high group had lower glucose at 45, 60 and 75 minutes, and a lower peak and area under the curve. After glucose the groups did not differ, and high-amylase people had more copies of the AMY1 gene. The authors suggest low-amylase people may face greater insulin resistance risk on starch-rich diets, an idea this small study did not test.
Four studies: more AMY1 copies, faster starch digestion, modestly higher glucose
The group genotyped 201 healthy adults, tested foods in 114, compared 40 at the copy-number extremes and tracked breath gases for 8 hours in 30. Glucose after starchy foods was 15% higher in the highest tenth of copy number than in the lowest. Copy number explained 26% to 61% of the differences in glucose response to starchy foods, but not to sucrose or fruit. People with low copy number had more than 6-fold higher breath methane. More copies with higher glucose is the reverse of the card above, and the groups were small.
45 studies: 90 g of whole grains a day, less cardiovascular disease
This dose-response meta-analysis pooled 45 prospective studies (64 publications). Per 90 g a day, three servings such as two slices of bread and one bowl of cereal, the risk was 0.78 times as high. It was 0.81 for coronary heart disease, 0.88 for stroke (which could be chance), 0.85 for cancer deaths and 0.83 for deaths from all causes. Whole grain bread, breakfast cereals and added bran also went with lower risk; refined grains, white rice, total rice and total grains showed little link. The studies were observational, so whole grain eaters may differ in other ways; the authors report no funding or conflicts.
Three US cohorts: frequent potatoes, 33% higher type 2 diabetes risk
That compares 7 or more servings a week with under 1 serving a week (hazard ratio 1.33). The cohorts were the Nurses’ Health Study (70,773 women), the second Nurses’ Health Study (87,739 women) and the Health Professionals Follow-up Study (40,669 men). There were 15,362 new cases of type 2 diabetes over 3,988,007 person-years. Per 3 servings a week, the hazard ratio was 1.04 for baked, boiled or mashed potatoes and 1.19 for french fries. Swapping 3 weekly servings of potatoes for whole grains went with a ratio of 0.88, in observational data from food questionnaires.
Cohorts: each daily white rice serving, 11% higher type 2 diabetes risk
This meta-analysis pooled seven prospective cohort analyses from four articles: 13,284 cases among 352,384 people followed for 4 to 22 years. The link was strong in Asian populations, who eat three to four servings a day (highest against lowest intake, relative risk 1.55). It was not clear in Western populations, who eat one to two servings a week (1.12). Overall, the relative risk was 1.11 per daily serving, and the data are observational.
16 studies: acrylamide not linked to most cancers, except lung in smokers
This dose-response meta-analysis of non-gynecological cancers covered 31 papers on 16 studies with 1,151,189 people. 48,175 people developed cancer over a median 14.9 years; mean estimated intake was 23 µg (micrograms) a day, and no threshold appeared. Acrylamide forms when starchy foods are fried or baked, and EFSA still treats it as a potential cancer risk, based on animal studies. The safety section has the official view; the data are observational, and the authors report no conflicts.
Genetic studies: fewer AMY1 copies went with higher BMI and obesity
This copy-number study in fat tissue, replicated in 6,200 people, linked more AMY1 copies to more amylase gene expression and higher blood enzyme levels. Fewer copies went with a higher BMI, or body mass index (−0.15 kg/m² per estimated copy). The odds ratio for obesity was 1.19 per estimated copy, which the authors translate into about an eightfold difference between the top and bottom tenth. It is a genetic association, not a trial, and the next card did not replicate it.
Estonians and about 3,500 others: AMY1 copies not linked to BMI
The team mapped the amylase locus, found eight common structural forms, and measured copy number in 1,000 obese or lean Estonians and 2 other cohorts. With 99% power to detect the lower bound of the earlier reported effects on BMI, they still found no association. Two authors are employees of BioNano Genomics and own stock options in it.
Foods high in starch
Starch comes from seeds, tubers and some fruit: grains, beans and lentils, potatoes, corn, plantains and the foods made from them. The US Dietary Guidelines define starchy vegetables as, for example, cassava, corn, lima beans, plantains, white potatoes, taro and yam.
In our USDA ranking, per serving, potatoes lead with 32.6 g in 1 medium potato (213 g). Navy beans (28 g in 1 cup) and pinto beans (25.9 g in 1 cup) come next. Then come spelt, quinoa, sweet potatoes, cashews, bananas, scallops and carrots; the ranking below gives each amount.
Per 100 g the order changes: spelt (53.9 g) and quinoa (52.2 g) lead, ahead of cashews, navy beans, potatoes and pinto beans. Per 100 kcal, potatoes lead with 19.9 g, then spelt, quinoa, navy beans and pinto beans.
Read the ranking with care. Our data hold a starch value for only a small set of foods (25 at the time of writing). So staples such as rice, bread and pasta are not in the top list. The same food can carry very different starch, and very different digestibility, depending on what is done to it.
The National Academies chapter lists factors that slow starch digestion. They include a high amylose share, intact grains and large particles, raw or ungelatinized starch, and an intact seed coat as in whole grains. It also notes that starch falls and free sugar rises as fruit ripens.
Cooking and then cooling adds a twist. In a lab study, baked potatoes had more resistant starch than boiled ones, and chilled potatoes more than hot or reheated ones. In rice, cooling for 24 hours at 4 °C and reheating raised resistant starch from 0.64 to 1.65 g per 100 g.
Per serving. No daily amount is set, so bars compare each food with the top food.
Per 100 g. No daily amount is set, so bars compare each food with the top food.
Per 100 kcal: the same calories of each food, for a fair comparison. Bars compare each food with the top food.
Food labels have no Daily Value or Reference Intake for starch, so the % compares each food with the top food.
- 1.

- 2.
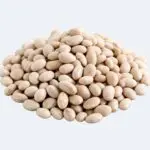
- 3.
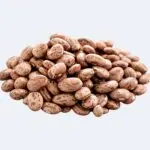
- 4.
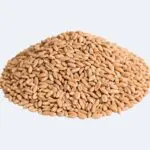
- 5.
- 6.

- 7.

- 8.

- 9.

- 10.



- 1.
- 2.
- 3.
- 4.
- 5.
- 6.
- 7.
- 8.
- 9.
- 10.

- 1.
- 2.
- 3.
- 4.
- 5.
- 6.
- 7.
- 8.

- 9.
- 10.

Sources
- U.S. Department of Agriculture, Agricultural Research Service. FoodData Central. Values as shown in the ranking above.
- Institute of Medicine, Food and Nutrition Board. Dietary Reference Intakes for energy, carbohydrate, fiber, fat, fatty acids, cholesterol, protein, and amino acids. National Academies Press. 2005. Chapter 6, “Dietary Carbohydrates: Sugars and Starches”, pages 265 to 273.
- Raatz SK, Idso L, Johnson LK, et al. Resistant starch analysis of commonly consumed potatoes: Content varies by cooking method and service temperature but not by variety. Food Chem. 2016.
- Sonia S, Witjaksono F, Ridwan R. Effect of cooling of cooked white rice on resistant starch content and glycemic response. Asia Pac J Clin Nutr. 2015.
- U.S. Department of Agriculture and U.S. Department of Health and Human Services. Dietary Guidelines for Americans, 2020-2025. 9th edition. 2020.
How starch works
The chemistry and digestion of starch are textbook material, and the cards above test what they mean in people. Five ideas cover most of it.
Starch is two molecules, one straight and one branched. Digestion starts in the mouth and ends as glucose, and a small share escapes to the colon. The speed of digestion differs between foods and between people, and cooking and cooling change it. Here is each one, and what has been seen in people.
Starch is two molecules, one straight and one branched
The National Academies define starch as fewer than 1,000 to many thousands of glucose units joined by α-linkages. Amylose is the linear form, with α-(1,4) bonds. Amylopectin has the same linear chains plus branches through α-(1,6) bonds.
The two behave differently. Amylose is compact, has low solubility and is digested less rapidly. It readily retrogrades: its chains bond to each other through hydrogen bonds, which forms resistant starch type 3. Amylopectin is digested more quickly, presumably because its open, branched structure gives enzymes more places to attack.
A high ratio of amylose to amylopectin is one of the listed factors that lower the glycemic index. Starch and glycogen are the storage forms of carbohydrate in plants and animals.
Digestion starts in the mouth and ends as glucose
The breakdown begins in the mouth, where salivary amylase cuts the interior α-(1,4) bonds of amylose and amylopectin. It continues in the small intestine, where the pancreas releases more amylase. This leaves large pieces called α-limit dextrins, with about eight glucose units and at least one α-(1,6) bond.
Enzymes on the gut lining finish the job. Glucoamylase takes glucose off the ends to yield maltose and isomaltose, which maltase and sucrase then split. The glucose crosses the gut lining by sodium-dependent transporters (SGLTs) and leaves the cell into the blood by GLUT2.
How the body digests starch, simplified. Not to scale.
A small share escapes into the colon
Seven people with an ileostomy, which lets researchers collect what leaves the small intestine, ate oats, cornflakes and white bread. Only 4% of the starch in cornflakes, 2.5% in white bread and under 0.6% in oats came out as starch.
That share is the resistant starch. The lab method that Englyst, Kingman and Cummings developed gives values similar to what escaped in ileostomy studies. So it is a guide to what reaches the colon, where the starch is fermented.
In a trial, a high resistant starch diet raised butyrate and acetate in stool. Bacteria such as Ruminococcus bromii and Bifidobacterium adolescentis, which the authors call resistant-starch degrading, were more common in people who responded.
Responses differ widely. When 20 adults took potato resistant starch, stool butyrate rose from 8 to 12 mmol/kg on average. But 6 of the 20 showed no rise. So resistant starch is a close cousin of fiber in the colon, though it did not match fiber in the cancer trial above.
Share of the starch in each food that came out of the small intestine as starch, in 7 people with an ileostomy, drawn to scale. Oats gave a further 1.2% as dextrins and maltose.
Some people carry more copies of the salivary amylase gene
The number of copies of the salivary amylase gene (AMY1) varies from person to person and tracks the level of amylase in saliva. Perry and colleagues found that populations with high-starch diets have, on average, more AMY1 copies than populations with traditionally low-starch diets. They read this as a sign of selection.
What the copy number means for health is unsettled. In 14 healthy adults, high-amylase people had lower blood glucose after a starch drink. But in a larger set of linked studies, higher copy number went with higher glucose after starchy foods.
A genetic study linked fewer copies to obesity, and a later study with 99% power found no link. We found no trial that tests advice by copy number, so none can be given.
Fast and slow starch
The glycemic index (GI) measures the blood glucose response to a fixed amount of carbohydrate in a food, against white bread or glucose. The National Academies note that two things set it most: the type of carbohydrate, and physical factors that govern how fast it is digested.
In their table of published values, with white bread at 100, low-amylose white rice scored 126 and a baked potato 121. Boiled spaghetti scored 83, chickpeas 47 and kidney beans 42, while table sugar (sucrose) scored 92.
The report also warns that the GI does not consider the different metabolic responses to sugars and starches. It made no recommendation based on GI, because evidence for preventing chronic disease was too thin. The WHO’s 2023 carbohydrate guideline rated the certainty of evidence for glycemic load, which also counts the amount of carbohydrate, as low.
Englyst and colleagues sorted starch by speed into rapidly digestible, slowly digestible and resistant fractions. Their lab method gives rapidly and slowly digestible values that reflect the rate of digestion in the body. In 8 healthy adults, the rapidly available glucose in a meal explained 70% of the remaining variation in blood glucose response.
A later trial warns about the limits of lab values. Cereal bars with resistant starch were digested about 30% more slowly in the lab but gave no lower blood glucose.
Cooking and cooling change the starch
The National Academies list raw, ungelatinized starch among the factors that slow digestion. So cooking, which gelatinizes (swells and softens) starch, is part of why cooked starchy foods are digested more readily. When cooked starch cools, amylose chains bond to each other again: this is the retrogradation that forms resistant starch type 3.
In rice, resistant starch rose from 0.64 to 1.30 g per 100 g after 10 hours of cooling at room temperature. It reached 1.65 g after 24 hours at 4 °C and reheating. In 15 healthy adults, that reheated rice gave a blood glucose response of 125 against 152 for fresh rice. In 32 adults with type 1 diabetes, it gave a lower curve and more low blood sugar.
The effect on glucose is modest, and the one lab study of potatoes measured only starch, not glucose. A trial of pasta found that reheated pasta gave a slightly lower glucose area than hot pasta (703 against 735 mmol·min/L). Cold pasta did not differ significantly.
White rice, drawn to scale from zero. The two groups of bars use different scales. The glucose response is the area under the curve; the trial was small and single-blind.
What has been seen in people
Putting the cards together: resistant starch swapped for digestible starch lowers the blood glucose rise after a meal (the EU claim), and fasting glucose slightly. In small trials, 15 to 40 g a day raised stool bulk and butyrate. It raised insulin sensitivity in two small trials and did not in people with type 2 diabetes. Lab digestion values do not always match the body, as the cereal bar trial shows.
For whole foods, whole grains go with lower cardiovascular risk in cohorts, while trials are too short. Potatoes, french fries and white rice go with higher diabetes risk in cohorts. Results for salivary amylase copy number conflict.
The trials of resistant starch used supplements or modified flours, in doses that are hard to reach from ordinary meals. So treat those results as a test of the idea, not as advice about potatoes and rice.
Sources
- Institute of Medicine, Food and Nutrition Board. Dietary Reference Intakes for energy, carbohydrate, fiber, fat, fatty acids, cholesterol, protein, and amino acids. National Academies Press. 2005. Chapter 6, “Dietary Carbohydrates: Sugars and Starches”, pages 265 to 273.
- Englyst HN, Cummings JH. Digestion of the polysaccharides of some cereal foods in the human small intestine. Am J Clin Nutr. 1985.
- Englyst HN, Kingman SM, Cummings JH. Classification and measurement of nutritionally important starch fractions. Eur J Clin Nutr. 1992.
- Venkataraman A, Sieber JR, Schmidt AW, et al. Variable responses of human microbiomes to dietary supplementation with resistant starch. Microbiome. 2016.
- Perry GH, Dominy NJ, Claw KG, et al. Diet and the evolution of human amylase gene copy number variation. Nat Genet. 2007.
- Englyst KN, Englyst HN, Hudson GJ, et al. Rapidly available glucose in foods: an in vitro measurement that reflects the glycemic response. Am J Clin Nutr. 1999.
- Sonia S, Witjaksono F, Ridwan R. Effect of cooling of cooked white rice on resistant starch content and glycemic response. Asia Pac J Clin Nutr. 2015.
- Hodges C, Archer F, Chowdhury M, et al. Method of Food Preparation Influences Blood Glucose Response to a High-Carbohydrate Meal: A Randomised Cross-over Trial. Foods. 2019.
- World Health Organization. Carbohydrate intake for adults and children: WHO guideline. 2023.
- Raatz SK, Idso L, Johnson LK, et al. Resistant starch analysis of commonly consumed potatoes: Content varies by cooking method and service temperature but not by variety. Food Chem. 2016.
How much starch do you need?
There is no recommended amount of starch on its own. The National Academies set a recommended dietary allowance (RDA) of 130 g a day for all carbohydrate, sugars and starch together. It covers nearly all healthy people and is based on the average minimum amount of glucose the brain uses. They also set an acceptable range of 45% to 65% of energy from carbohydrate.
On a 2,000 kcal diet, 45% to 65% is 900 to 1,300 kcal, or 225 to 325 g of carbohydrate at 4 kcal per gram. That is our arithmetic, using the FDA’s labeling factor. The Academies report median intakes of about 220 to 330 g a day in men and 180 to 230 g in women.
| Source | Group | Value | Notes |
|---|---|---|---|
| National Academies (NASEM), 2005 | Adults and children | RDA for carbohydrate: 130 g a day. AMDR: 45% to 65% of energy | The RDA rests on the average minimum glucose use of the brain. The report made no recommendation based on glycemic index. No separate value for starch. |
| EFSA, 2010 (summary of Dietary Reference Values, 2017) | Adults and children from age 1 | Total carbohydrates: reference intake range 45% to 60% of energy; dietary fibre 25 g a day for adults | EFSA sets no separate value for starch. On 2,000 kcal, 45% to 60% is 225 to 300 g (our arithmetic). |
| WHO guideline, 2023 | Everyone aged 2 and older | Carbohydrate should come primarily from whole grains, vegetables, fruits and pulses (strong recommendation); at least 25 g a day of naturally occurring fiber in adults | The guideline team wanted to give advice on rapidly versus slowly digested starch but could not find studies that measured digestibility accurately, so it reviewed food sources of starch instead. |
| Dietary Guidelines for Americans, 2025-2030 | People aged 2 and older | Prioritize fiber-rich whole grains, with a goal of 2 to 4 whole grain servings a day; significantly reduce highly processed, refined carbohydrates such as white bread, packaged breakfast options, flour tortillas and crackers | Current edition. It names no amount of starch. |
| Dietary Guidelines for Americans, 2020-2025 (previous edition) | People aged 2 and older | At least half of total grains should be whole grains | The 2020-2025 edition also listed white potatoes, corn and plantains as starchy vegetables. |
| FDA Nutrition Facts label (21 CFR 101.9) | Adults and children aged 4 and older | Daily Value for total carbohydrate: 275 g, based on 2,000 kcal | There is no Daily Value for starch, and the site’s intake box shows no FDA or EU reference value for it. |
Starch is not an essential nutrient in the strict sense: the body can make the glucose it needs. The RDA exists because the brain uses glucose, not because starch itself is required. We found no deficiency state for starch and no upper limit set for it, so this page has no deficiency section.
What changes health outcomes is the kind of starchy food and how it is prepared. That is why the recent guidelines speak about whole grains, vegetables and pulses rather than starch grams.
Sources
- Institute of Medicine, Food and Nutrition Board. Dietary Reference Intakes for energy, carbohydrate, fiber, fat, fatty acids, cholesterol, protein, and amino acids. National Academies Press. 2005. Chapter 6, “Dietary Carbohydrates: Sugars and Starches”, pages 265 to 273.
- Institute of Medicine, Food and Nutrition Board. Dietary Reference Intakes for energy, carbohydrate, fiber, fat, fatty acids, cholesterol, protein, and amino acids. National Academies Press. 2005. Chapter 11, summary of the Acceptable Macronutrient Distribution Ranges, page 769.
- European Food Safety Authority. Summary of Dietary Reference Values for the EU population (version 4). 2017. The values for carbohydrates and dietary fibre come from the opinion of the EFSA NDA Panel, 2010.
- World Health Organization. Carbohydrate intake for adults and children: WHO guideline. 2023.
- U.S. Department of Health and Human Services and U.S. Department of Agriculture. Dietary Guidelines for Americans, 2025-2030. 2025-2030 edition.
- U.S. Department of Agriculture and U.S. Department of Health and Human Services. Dietary Guidelines for Americans, 2020-2025. 9th edition. 2020.
- U.S. Food and Drug Administration. Nutrition labeling of food, 21 CFR 101.9. Electronic Code of Federal Regulations.
Forms of starch: absorption and effects
Starch comes in forms that differ in how fast the body digests them. Englyst and colleagues classed it as rapidly digestible, slowly digestible and resistant starch.
Resistant starch is split into types by why it resists. Type 1 is starch physically locked inside intact plant cells, and type 2 is starch with a high amylose content. Type 3 is retrograded starch from cooking and cooling, and type 4 is chemically modified starch.
The honest bottom line: the trials mostly tested resistant starch types 1 and 2 as supplements or modified flour. Type 3 has a few small trials in rice and pasta. We found no trial that shows one form of starch to be healthier for a healthy person than another.
Where trials exist, the doses are 15 to 40 g a day of resistant starch, often from high-amylose maize. We found no trial that tested a cooled potato at the dose of a normal meal against a hot one for health outcomes. Nor did we find any showing that cooling pasta or potatoes cuts the calories you absorb.
| Form | What it is | What studies show | Source |
|---|---|---|---|
| Rapidly digestible starch | Starch broken down quickly in the small intestine. Intact grains, raw starch and a high amylose share slow digestion | In 8 healthy adults, a lab measure of rapidly available glucose explained 70% of the remaining variance in glycemic response. WHO found low-certainty evidence of more dental caries with rapidly digested starches. | 2, 11, 12 |
| Slowly digestible starch | Starch digested slowly through the small intestine | The WHO guideline team could not review “replace rapidly with slowly digested starch” because few studies measured digestibility accurately, and reviewed food sources of starch instead. We found no trial that links slowly digestible starch to a disease outcome. | 1, 11 |
| Resistant starch type 1 (RS1) | Starch protected inside intact plant cell walls | In people with type 2 diabetes or prediabetes, RS1 lowered the glucose rise after a meal (standardized mean difference −0.54) and glucose after meals in longer trials (−0.38). | 4 |
| Resistant starch type 2 (RS2) | Starch with a high amylose content, such as high-amylose maize and unmodified raw potato starch | RS2 lowered the glucose rise after a meal (−0.96), fasting glucose and fasting insulin in people with diabetes or prediabetes. Insulin sensitivity rose in men in one trial and did not change in type 2 diabetes in another. Potato RS2 raised fecal butyrate from 8 to 12 mmol/kg in 20 adults, with wide differences between people. | 4, 5, 19 |
| Resistant starch type 3 (RS3) | Starch that retrogrades when cooked starch cools, as in cooked and cooled rice, potatoes and pasta | Cooling rice raised resistant starch from 0.64 to 1.65 g per 100 g and lowered the glucose response in 15 healthy adults. In 32 adults with type 1 diabetes it lowered glucose but also raised hypoglycemia. Baked potatoes had more than boiled; chilled had more than hot or reheated. Reheated pasta gave a slightly lower glucose area than hot pasta (703 against 735 mmol·min/L). | 12, 7, 10, 8, 9 |
| Resistant starch type 4 (RS4) | Starch that has been chemically modified so that it resists digestion | The 2023 review says more research is needed on types 3, 4 and 5. None of the cards on this page tests RS4 on its own. | 4 |
| Resistant starch added to a processed food | Cereal bars with 10% or 15% resistant starch by weight | Digested about 30% more slowly in the lab, but gave no lower glucose or insulin response than control bars in 12 healthy adults. | 6 |
| Potato side dish | A potato dish compared with a refined grain dish, once a day | The potato dishes held more resistant starch (1.31% against 0.73% wet basis) and changed the gut bacteria in 50 adults, but fecal butyrate did not change. | 13 |
| Whole grains | Whole-grain products as the US guidelines list them: for example brown rice, oats, quinoa, bulgur and whole-wheat bread | Each 90 g a day went with lower cardiovascular risk in cohorts (relative risk 0.78). Nine trials of 12 to 16 weeks found no change in total cholesterol. The 2025-2030 US guidelines say to prioritize fiber-rich whole grains. | 14, 15, 16, 17 |
| White rice and other refined grains | Refined-grain products as the US guidelines list them: white bread, white rice, pasta and refined-grain cereals | Each daily serving of white rice went with an 11% higher risk of type 2 diabetes in a cohort meta-analysis (strong in Asian populations, not significant in Western ones). The 2025-2030 US guidelines say to reduce highly processed refined carbohydrates such as white bread. | 18, 14, 16, 17 |
Here are the form-specific studies, 5 in all, all at limited level because they are small or measure lab values.
All 5 studies, strongest evidence first
7 people with an ileostomy: 4% or less of starch escaped digestion
The seven ate test meals of oats, cornflakes and white bread, and the carbohydrate leaving their small intestine was measured. Recovered as starch: under 0.6% for oats (plus 1.2% as dextrins and maltose), 4% for cornflakes and 2.5% for white bread. Most starch that escaped from cornflakes and bread resisted amylase in the test tube unless it was specially dispersed. Non-starch polysaccharides, the main part of fiber, were almost completely recovered, and the authors named this starch fraction in processed food resistant starch.
In 8 adults, a lab measure of fast glucose predicted blood glucose
Eight healthy adults ate 8 test meals with 11 to 49 g of rapidly available glucose. That is glucose from sugars and starch likely to be absorbed quickly, measured in the lab by timed incubation with digestive enzymes. It explained 70% of the remaining variation in blood glucose response, a highly significant link. A given percentage rise in the lab value went with the same percentage rise in response.
12 healthy adults: lab-slowed starch bars did not lower blood glucose
The five whole-grain bars (10% or 15% resistant starch by weight, some with whey protein) and two controls each gave 40 g of available carbohydrate. The resistant starch bars were digested about 30% more slowly in the lab. Over 3 hours, the high resistant starch bars without whey protein gave glucose responses of 144 and 169, similar to the controls (140 and 164). Whey protein lowered the glucose response but raised the insulin-to-glucose ratio, and the authors warn against reading body responses from lab digestion.
In 15 adults, cooled and reheated rice gave a lower glucose response
Lab analysis found 0.64 g of resistant starch per 100 g in fresh rice and 1.30 g in rice cooled 10 hours at room temperature. Rice cooled for 24 hours at 4 °C and then reheated held 1.65 g. In the healthy adults, this 24-hour, 4 °C rice gave a glucose response of 125 against 152 mmol·min/L for fresh rice. The trial was small, single-blind and tested one kind of white rice.
Type 1 diabetes: 24-hour cooled rice, lower glucose but more lows
Each of the 32 ate two standard meals of long-grain white rice, one fresh and one cooled for 24 hours at 4 °C and reheated. Over 3 hours of flash-sensor monitoring, the cooled rice gave a lower peak, rise and area under the curve, and an earlier peak. Low blood sugar episodes were more common after cooled rice: 12 (38%) against 3 (9%). The authors warn of this on the usual insulin dose.
Sources
- Englyst HN, Kingman SM, Cummings JH. Classification and measurement of nutritionally important starch fractions. Eur J Clin Nutr. 1992.
- Englyst KN, Englyst HN, Hudson GJ, et al. Rapidly available glucose in foods: an in vitro measurement that reflects the glycemic response. Am J Clin Nutr. 1999.
- Englyst HN, Cummings JH. Digestion of the polysaccharides of some cereal foods in the human small intestine. Am J Clin Nutr. 1985.
- Pugh JE, Cai M, Altieri N, et al. A comparison of the effects of resistant starch types on glycemic response in individuals with type 2 diabetes or prediabetes: A systematic review and meta-analysis. Front Nutr. 2023.
- Venkataraman A, Sieber JR, Schmidt AW, et al. Variable responses of human microbiomes to dietary supplementation with resistant starch. Microbiome. 2016.
- Wolever TM, van Klinken BJ, Bordenave N, et al. Reformulating cereal bars: high resistant starch reduces in vitro digestibility but not in vivo glucose or insulin response; whey protein reduces glucose but disproportionately increases insulin. Am J Clin Nutr. 2016.
- Sonia S, Witjaksono F, Ridwan R. Effect of cooling of cooked white rice on resistant starch content and glycemic response. Asia Pac J Clin Nutr. 2015.
- Raatz SK, Idso L, Johnson LK, et al. Resistant starch analysis of commonly consumed potatoes: Content varies by cooking method and service temperature but not by variety. Food Chem. 2016.
- Hodges C, Archer F, Chowdhury M, et al. Method of Food Preparation Influences Blood Glucose Response to a High-Carbohydrate Meal: A Randomised Cross-over Trial. Foods. 2019.
- Strozyk S, Rogowicz-Frontczak A, Pilacinski S, et al. Influence of resistant starch resulting from the cooling of rice on postprandial glycemia in type 1 diabetes. Nutr Diabetes. 2022.
- World Health Organization. Carbohydrate intake for adults and children: WHO guideline. 2023.
- Institute of Medicine, Food and Nutrition Board. Dietary Reference Intakes for energy, carbohydrate, fiber, fat, fatty acids, cholesterol, protein, and amino acids. National Academies Press. 2005. Chapter 6, “Dietary Carbohydrates: Sugars and Starches”, pages 265 to 273.
- DeMartino P, Johnston EA, Petersen KS, et al. Additional Resistant Starch from One Potato Side Dish per Day Alters the Gut Microbiota but Not Fecal Short-Chain Fatty Acid Concentrations. Nutrients. 2022.
- Aune D, Keum N, Giovannucci E, et al. Whole grain consumption and risk of cardiovascular disease, cancer, and all cause and cause specific mortality: systematic review and dose-response meta-analysis of prospective studies. BMJ. 2016.
- Kelly SA, Hartley L, Loveman E, et al. Whole grain cereals for the primary or secondary prevention of cardiovascular disease. Cochrane Database Syst Rev. 2017.
- U.S. Department of Health and Human Services and U.S. Department of Agriculture. Dietary Guidelines for Americans, 2025-2030. 2025-2030 edition.
- U.S. Department of Agriculture and U.S. Department of Health and Human Services. Dietary Guidelines for Americans, 2020-2025. 9th edition. 2020.
- Hu EA, Pan A, Malik V, et al. White rice consumption and risk of type 2 diabetes: meta-analysis and systematic review. BMJ. 2012.
- Baxter NT, Schmidt AW, Venkataraman A, et al. Dynamics of Human Gut Microbiota and Short-Chain Fatty Acids in Response to Dietary Interventions with Three Fermentable Fibers. mBio. 2019.
Is starch safe? Limits, acrylamide and who should watch it
Starch from ordinary food is safe for almost everyone, and we found no tolerable upper limit for it. The larger concern is how starchy foods are cooked. Frying, baking or roasting at high temperature (above 120 °C, with low moisture) makes sugars react with the amino acid asparagine. This Maillard reaction forms acrylamide.
In 2015 EFSA’s contaminants panel confirmed that acrylamide in food potentially increases cancer risk for consumers of all ages, based on animal studies. Evidence from human studies is limited and inconclusive, and the cohort meta-analysis above found no link for most cancers.
Fried potato products and coffee are the biggest sources for adults, then soft bread, biscuits, crackers and crisp breads. For most children, fried potato products supply up to half of exposure.
- Acrylamide and cooking. From 11 April 2018, EU rules oblige makers of french fries, potato crisps, bread, breakfast cereals and biscuits to apply mitigation measures. They must aim for acrylamide levels as low as reasonably achievable below set benchmark levels. Examples are 500 µg/kg for ready-to-eat french fries, 750 µg/kg for potato crisps and 50 µg/kg for wheat-based soft bread. For home cooking, EFSA’s literature summary, which EFSA says it did not evaluate, notes that acrylamide tracks browning. Frying above 175 °C can raise it greatly in french fries. Storing raw potatoes below 8 °C generally raises sugars, and so may raise acrylamide after cooking.
- Resistant starch and gut symptoms. In the 1995 trial, 39 g a day of resistant starch increased flatulence, along with easier defecation. In the trial with 30 g a day, the supplement was well tolerated. Trials used 15 to 40 g a day; we found no official upper limit.
- Diabetes and insulin. If you have diabetes, plan changes in starch with your care team. Cooled and reheated rice lowered the glucose rise in type 1 diabetes, but went with more low blood sugar (hypoglycemia) on the usual insulin dose.
- Teeth. The WHO 2023 review found low-certainty evidence of more dental caries with rapidly digested starches and no link to caries for non-sugar carbohydrate intake overall.
- Drug interactions. We found no report of an interaction between dietary starch and a medicine. If you take insulin or other glucose-lowering drugs, match your doses to your carbohydrate intake with a doctor or dietitian.
How to choose better starchy foods
- Pick intact and whole forms. Whole grains, beans and lentils went with lower risk in cohorts (relative risk 0.78 per 90 g a day of whole grains). Swapping 3 servings a week of potatoes for whole grains went with a hazard ratio of 0.88 for type 2 diabetes. The 2025-2030 US guidelines tell people to prioritize fiber-rich whole grains.
- Try cooking, cooling and reheating. Rice cooled for 24 hours at 4 °C and reheated held 1.65 g of resistant starch per 100 g, against 0.64 g fresh. It gave a lower glucose response in 15 healthy adults. If you have type 1 diabetes, be careful, because of the hypoglycemia seen in the trial.
- Brown it, do not burn it. EFSA notes that acrylamide levels follow the browning of these foods, and that some countries advise lightly browning rather than burning them. Varying cooking methods, such as boiling, steaming and sautéing as well as frying and roasting, could help lower exposure.
Sources
- European Food Safety Authority. Acrylamide (topic page with questions and answers) and Acrylamide in food is a public health concern (news story on the 2015 scientific opinion of the CONTAM Panel, EFSA Journal 2015;13(6):4104). 4 June 2015.
- European Commission. Regulation (EU) 2017/2158 establishing mitigation measures and benchmark levels for the reduction of the presence of acrylamide in food. 20 November 2017. Articles 1 and 6 and Annex IV.
- Phillips J, Muir JG, Birkett A, et al. Effect of resistant starch on fecal bulk and fermentation-dependent events in humans. Am J Clin Nutr. 1995.
- Robertson MD, Bickerton AS, Dennis AL, et al. Insulin-sensitizing effects of dietary resistant starch and effects on skeletal muscle and adipose tissue metabolism. Am J Clin Nutr. 2005.
- Filippini T, Halldorsson TI, Capitão C, et al. Dietary Acrylamide Exposure and Risk of Site-Specific Cancer: A Systematic Review and Dose-Response Meta-Analysis of Epidemiological Studies. Front Nutr. 2022.
- World Health Organization. Carbohydrate intake for adults and children: WHO guideline. 2023.
- U.S. Department of Health and Human Services and U.S. Department of Agriculture. Dietary Guidelines for Americans, 2025-2030. 2025-2030 edition.
- Aune D, Keum N, Giovannucci E, et al. Whole grain consumption and risk of cardiovascular disease, cancer, and all cause and cause specific mortality: systematic review and dose-response meta-analysis of prospective studies. BMJ. 2016.
- Muraki I, Rimm EB, Willett WC, et al. Potato Consumption and Risk of Type 2 Diabetes: Results From Three Prospective Cohort Studies. Diabetes Care. 2016.
- Sonia S, Witjaksono F, Ridwan R. Effect of cooling of cooked white rice on resistant starch content and glycemic response. Asia Pac J Clin Nutr. 2015.
- Strozyk S, Rogowicz-Frontczak A, Pilacinski S, et al. Influence of resistant starch resulting from the cooling of rice on postprandial glycemia in type 1 diabetes. Nutr Diabetes. 2022.
- Tareke E, Rydberg P, Karlsson P, et al. Analysis of acrylamide, a carcinogen formed in heated foodstuffs. J Agric Food Chem. 2002.
- Mottram DS, Wedzicha BL, Dodson AT. Acrylamide is formed in the Maillard reaction. Nature. 2002.
History of starch
Eating starch is a prominent feature of farming societies and of hunter-gatherers in arid environments. In 2007 Perry and colleagues found more salivary amylase gene copies, on average, in populations with high-starch diets than in those with traditionally low-starch diets. They called it one of the first examples of positive selection on a copy number variable gene in the human genome.
The idea that part of the starch we eat is not digested is newer. In 1985 Englyst and Cummings fed oats, cornflakes and white bread to seven people with an ileostomy. They identified a fraction of starch in processed food that resisted both amylase in the test tube and digestion in the small intestine.
In 1992 Englyst, Kingman and Cummings published a method that classes starch as rapidly digestible, slowly digestible and resistant. That classification is still used.
Acrylamide became a starch story in 2002. A paper that traced hemoglobin adducts (blood markers of exposure) in Swedish adults reported acrylamide in heated carbohydrate-rich foods such as potato products and crispbread. Levels were 150 to 4,000 µg/kg, with none in unheated or boiled foods. The same year Mottram and colleagues showed that it forms in the Maillard reaction, with asparagine as a crucial participant.
EFSA says acrylamide was first detected in foods in April 2002. EFSA published its first full risk assessment in 2015, and the EU’s mitigation rules apply from 2018.
Sources
- Perry GH, Dominy NJ, Claw KG, et al. Diet and the evolution of human amylase gene copy number variation. Nat Genet. 2007.
- Englyst HN, Cummings JH. Digestion of the polysaccharides of some cereal foods in the human small intestine. Am J Clin Nutr. 1985.
- Englyst HN, Kingman SM, Cummings JH. Classification and measurement of nutritionally important starch fractions. Eur J Clin Nutr. 1992.
- Tareke E, Rydberg P, Karlsson P, et al. Analysis of acrylamide, a carcinogen formed in heated foodstuffs. J Agric Food Chem. 2002.
- Mottram DS, Wedzicha BL, Dodson AT. Acrylamide is formed in the Maillard reaction. Nature. 2002.
- European Food Safety Authority. Acrylamide (topic page with questions and answers) and Acrylamide in food is a public health concern (news story on the 2015 scientific opinion of the CONTAM Panel, EFSA Journal 2015;13(6):4104). 4 June 2015.
- European Commission. Regulation (EU) 2017/2158 establishing mitigation measures and benchmark levels for the reduction of the presence of acrylamide in food. 20 November 2017. Articles 1 and 6 and Annex IV.
Frequently asked questions about starch
What foods are starchy?
Grains and the foods made from them (rice, wheat, oats, spelt, quinoa, bread, pasta), beans and lentils, potatoes, corn and plantains. In our USDA ranking, per serving, a medium potato leads with 32.6 g of starch. Then come navy beans (28 g per cup), pinto beans (25.9 g), spelt (23.5 g per ¼ cup) and quinoa (22.2 g). Our data cover only a few foods, so the ranking is not a full list.
Are potatoes starchy vegetables?
Yes. The US Dietary Guidelines list white potatoes, corn, plantains, cassava, lima beans, taro and yam as starchy vegetables. In three US cohorts, 7 or more potato servings a week went with 33% higher type 2 diabetes risk than under 1. The link was strongest for french fries, and replacing potatoes with whole grains went with lower risk.
Is starch a carbohydrate?
Yes. Starch is a polysaccharide of glucose units, and the National Academies cover it together with the sugars in their chapter on dietary carbohydrates. Sugars are small molecules, starch is a long chain, and fiber has its own page. Most starch is digested to glucose.
Is starch worse for blood sugar than sugar?
Not necessarily; it depends on the food. In the National Academies table (white bread = 100), a baked potato scored 121, table sugar 92, kidney beans 42 and chickpeas 47. The report adds that the glycemic index does not consider the different metabolic responses to sugars and starches. Food form and cooking matter more than the label “starch” or “sugar”.
What is resistant starch, and does cooling rice create it?
Resistant starch escapes digestion in the small intestine and is fermented in the colon, and cooling cooked starch makes some of it. Rice cooled for 24 hours at 4 °C and reheated held 1.65 g per 100 g, against 0.64 g fresh. That rice gave a lower glucose response in 15 healthy adults, but the effect is modest. People with type 1 diabetes had more low blood sugar episodes.
Is resistant starch the same as fiber?
It behaves like fiber in the colon, where it is fermented to short-chain fatty acids. In a small trial, 39 g a day raised stool bulk and butyrate. But it did not act like a fiber-rich diet in the cancer trial. There, 30 g a day for up to 4 years did not change colorectal cancer risk in people with Lynch syndrome (hazard ratio 1.40). The EU claim covers only the blood glucose rise after a meal.
How much starch should I eat a day?
No amount is set for starch on its own. The National Academies recommend 130 g of carbohydrate a day and 45% to 65% of energy from carbohydrate, and EFSA gives 45% to 60%. On 2,000 kcal, that is 225 to 325 g or 225 to 300 g (our arithmetic). The 2025-2030 US guidelines say to prioritize fiber-rich whole grains and to cut highly processed refined carbohydrates.
Are acrylamide and burnt toast a worry?
EFSA says acrylamide in food potentially raises cancer risk for all ages, based on animal studies, while human evidence is limited and inconclusive. In a meta-analysis of 16 studies with 1,151,189 people, higher intake was not linked to most cancers. Browning drives the level, so cook starchy foods golden rather than dark, and vary methods.